

You work as a project manager for BlueWell Inc. Which of the following tools/techniques will you
use to demonstrate how a process behaves over time, and when a process is subject to special
cause variation, resulting in an out-of-control condition?

A.
Pareto Chart
B.
Ishikawa Diagram
C.
Scatter Chart
D.
Control Chart
Explanation:
You should use the control charts to demonstrate how a process behaves over time, and when a
process is subject to special cause variation, resulting in an out-of-control condition. Control charts
are graphical representations of different processes. These charts contain the maximum and
minimum values allowed. Control charts are used to determine whether or not a process is stable
or has predictable performance. A process is considered out of control when a data point exceeds
a control limit or if seven consecutive points are above or below the mean.
Answer option B is incorrect. The Ishikawa diagram (or fishbone diagram or also cause-and-effect
diagram) are diagrams, that shows the causes of a certain event. A common use of the Ishikawa
diagram is to identify potential factors causing an overall effect. It helps identify causal factors and
contributing causes.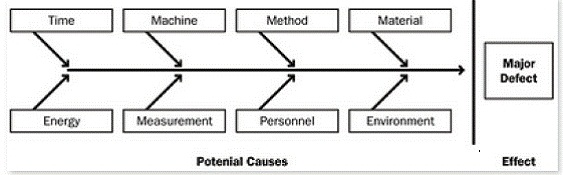
It is known as a fishbone diagram because of its shape, similar to the side view of a fish skeleton.
It is considered as a basic tool of quality management.
Answer option A is incorrect. A Pareto chart is a special type of bar chart where the values being
plotted are arranged in descending order. The graph is accompanied by a line graph, which shows
the cumulative totals of each category, left to right. The chart is named after Vilfredo Pareto, and
its use in quality assurance was popularized by Joseph M. Juran and Kaoru Ishikawa.
Answer option C is incorrect. A scatter chart is a type of display using Cartesian coordinates to
display values for two variables for a set of data. The data is displayed as a collection of points,
each having the value of one variable determining the position on the horizontal axis and the value
of the other variable determining the position on the vertical axis. A scatter diagram shows the
pattern of relationship between two variables. This tool allows the quality team to study andidentify the possible relationship between changes observed in two variables. Dependent variables
versus independent variables are plotted. The closer the points are to a diagonal line, the more
closely they are related.
