

Refer to the Exhibit.
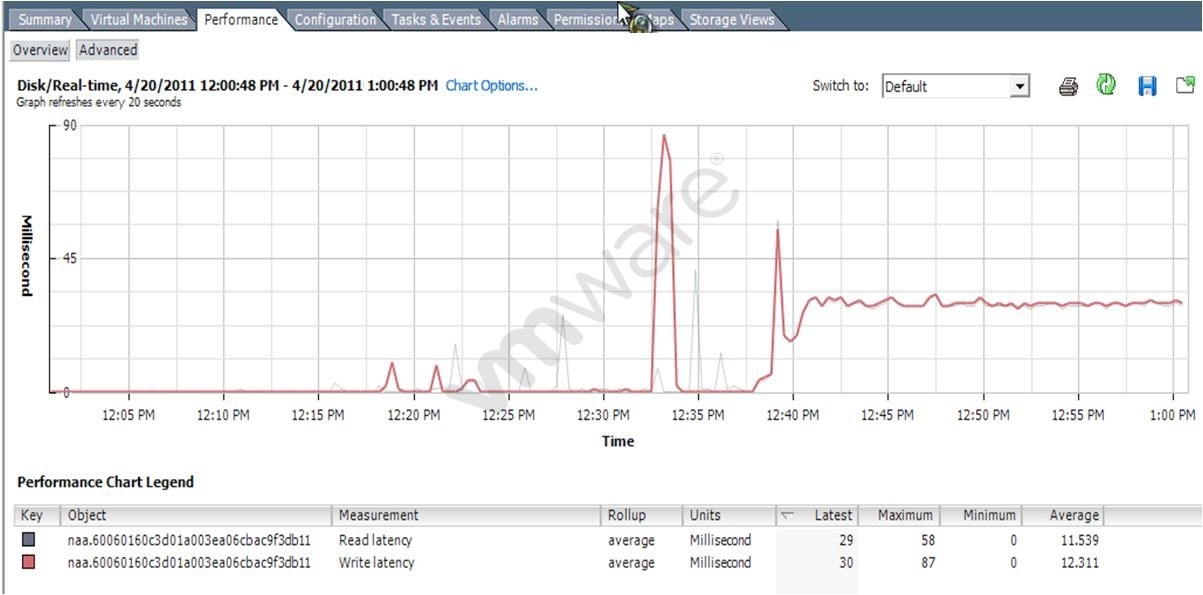
What does the graph in the exhibit indicate?

A.
The average amount of time SCSI reads and writes spend in the queue
B.
The average amount of time required to read and write from the guest operating system to the virtual machine virtual disk file
C.
The average amount of time spent by the VMkernel processing SCSI read and write commands
D.
The average amount of time spent reading and writing to the physical storage device
The screeshot shows the performance tab of a HOST, NOT A VM! So the good answer should be D.
0
0
Agree. B is definitely not correct since this exhibit is of a host and not a VM.
I’d go with A. C is wrong because we’re looking at disk latency, not kernel latency (it’s a different counter). D is wrong because avg time spent on R/W operations is again a different counter.
0
0
I’d go with D. The object column indicates a path to a physical device.
0
0