

Your network contains a domain controller named DC1 that runs Windows Server 2012 R2. You
create a custom Data Collector Set (DCS) named DCS1.
You need to configure DCS1 to collect the following information:
The amount of Active Directory data replicated between DC1 and the other domain controllers
The current values of several registry settings
Which two should you configure in DCS1? (Each correct answer presents part of the solution. Choose
two.)

A.
Event trace data
B.
A Performance Counter Alert
C.
System configuration information
D.
A performance counter
Explanation:
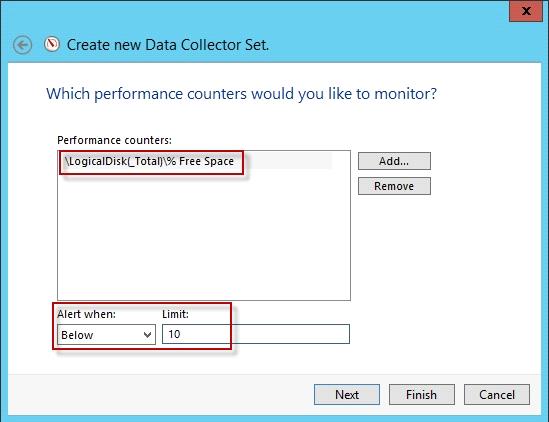
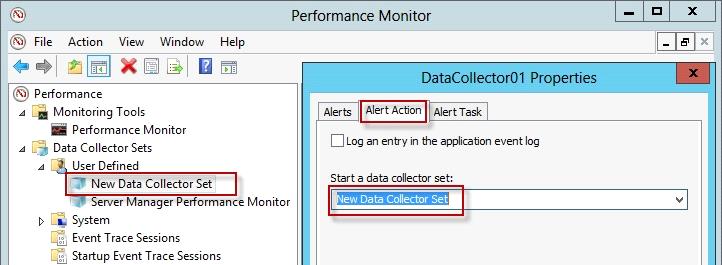
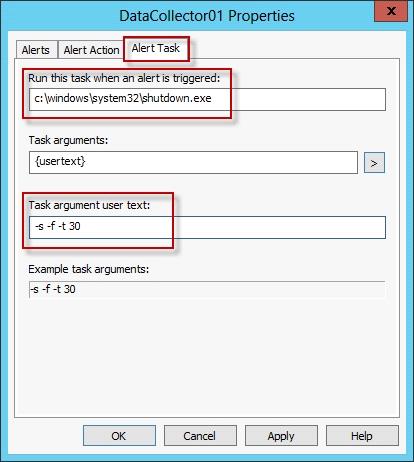
Automatically run a program when the amount of total free disk space on Server1 drops below 10
percent of capacity.
You can also configure alerts to start applications and performance logs
Log the current values of several registry settings.
System configuration information allows you to record the state of, and changes to, registry keys.
Total free disk space
Registry settings
Run a program on alert
httpHYPERLINK “http://technet.microsoft.com/en-us/library/cc766404.aspx#_blank”:
//technetHYPERLINK “http://technet.microsoft.com/en-us/library/cc766404.aspx#_blank”.
microsoftHYPERLINK “http://technet.microsoft.com/en-us/library/cc766404.aspx#_blank”. com/enus/library/cc766404HYPERLINK “http://technet.microsoft.com/enus/library/cc766404.aspx#_blank”. aspx


The question does not mention disk space falling below 10%, is B correct here?
0
0
C=The current values of several registry settings
D=The amount of Active Directory data replicated between DC1 and the other domain controllers.
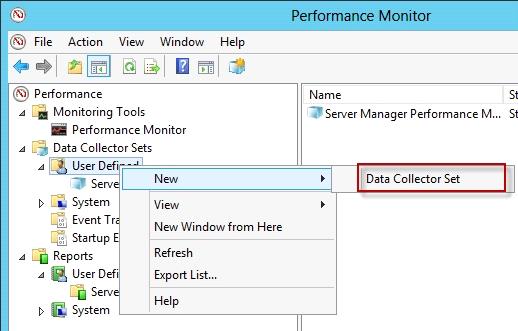
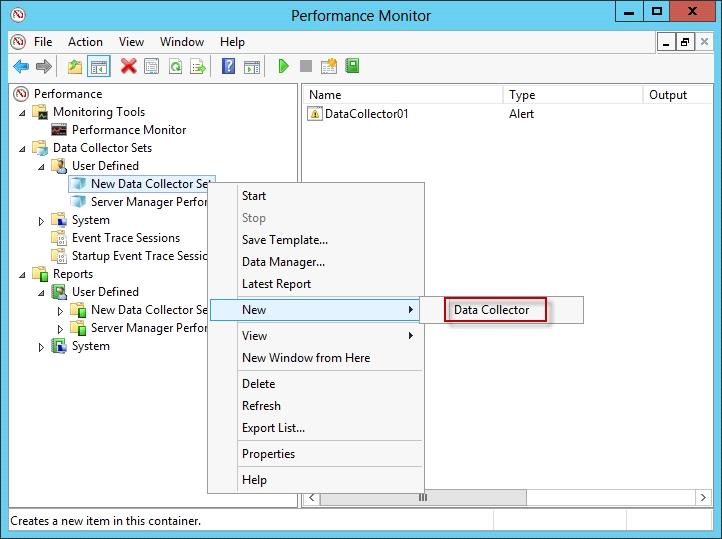
To create a Data Collector Set manually
In the Windows Performance Monitor navigation pane, expand Data Collector Sets , right-click User Defined , point to New , and click Data Collector Set . The Create new Data Collector Set Wizard starts.
Enter a name for your Data Collector Set.
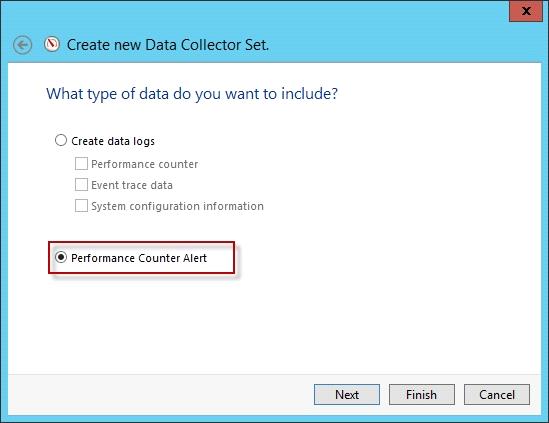
Select Create manually and click Next .
Select Create data logs .
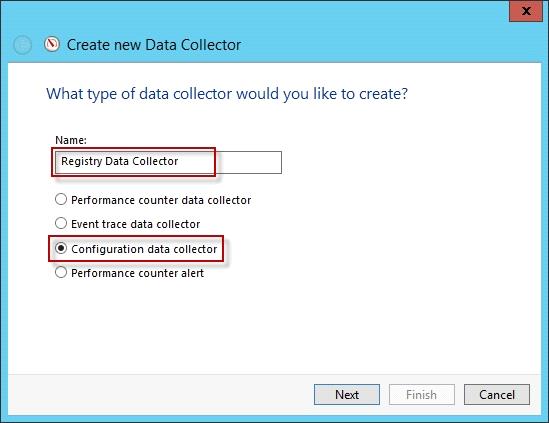
Check the boxes next to the Data Collector types you want to use and click Next .
Performance counters provide metric data about the system’s performance.
Event trace data provides information about activities and system events.
System configuration information allows you to record the state of, and changes to, registry keys.
Depending on the Data Collector types you selected, you will be presented with dialogs to add Data Collectors to your Data Collector Set.
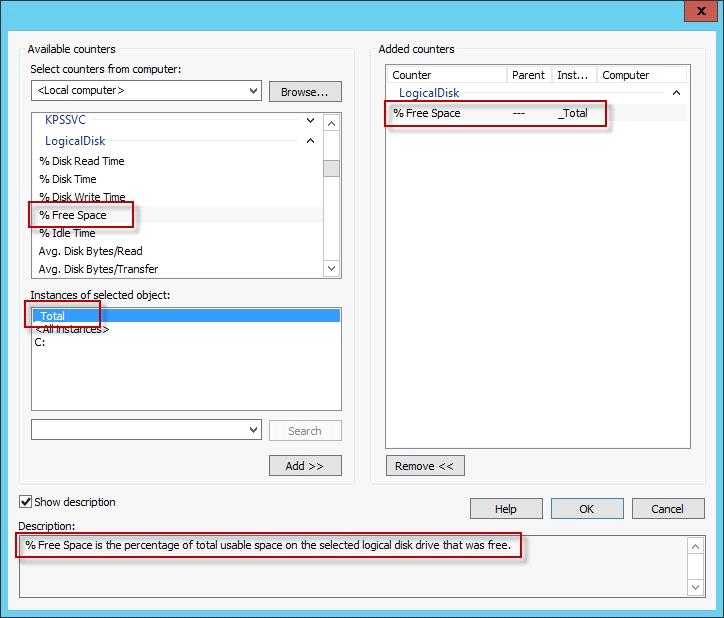
Click Add to open the Add Counters dialog box. When you are finished adding Performance counters, click Next to continue configuration or Finish to exit and save the current configuration.
Event Trace Providers can be installed with the operating system or part of a non-Microsoft application. Click Add to select from a list of available Event Trace Providers. You can select multiple providers by holding down the Control key and highlighting. When you are finished adding Event Trace Providers, click Next to continue configuration or Finish to exit and save the current configuration.
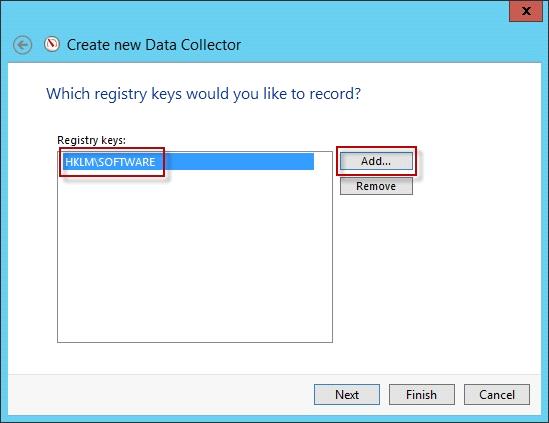
Record system configuration information by entering Registry keys you want to track. You must know the exact key you want to include in the Data Collector Set. When you are finished adding Registry keys, click Next to continue configuration or Finish to exit and save the current configuration.
2
0
C & D are right
0
0
Agree with Bas and Marcel – Answer c & D
B – doesn’t make sense
0
0
A and C
Reason: To create a Data Collector Set manually
In the Windows Performance Monitor navigation pane, expand Data Collector Sets , right-click User Defined , point to New , and click Data Collector Set . The Create new Data Collector Set Wizard starts.
Enter a name for your Data Collector Set.
Select Create manually and click Next .
Select Create data logs .
Check the boxes next to the Data Collector types you want to use and click Next .
Performance counters provide metric data about the system’s performance.
Event trace data provides information about activities and system events.
System configuration information allows you to record the state of, and changes to, registry keys.
0
1
How you monitor the amount of Active Directory data replicated between DC1 and the other domain controllers via Event trace data collector?
C & D looks OK. Replication traffic data may be collected via NTDS Performance counter group.
0
0
As in another question I’ve seen on here, the main difference between B and D is that one is an alert while the other is a collection.
If the question asks to create an alert or to be notified, perform an action such as shutdown, etc. when a certain event/process performance reaches ##%, then you would go with Performance Counter Alert.
In this question, however, it’s asking for a collection of data replication. That would be Performance Counter.
However, as I saw Chuck’s comment above (first one on this page), I took a closer look at the answer exhibits and noticed the submitter of this question and answer was more towards data collecting of disk space and perform a shutdown when it falls below 10%. So I think the submitter got his questions and answers for a similar question mixed up.
Overall, I think in the question as submitted above, C and D would fit. For what the answer shows which is probably for another question, you would do B and C.
0
0