

You have a server named Server1 that runs Windows Server 2012 R2.
You discover that the performance of Server1 is poor.
The results of a performance report generated on Server1 are shown in the following table.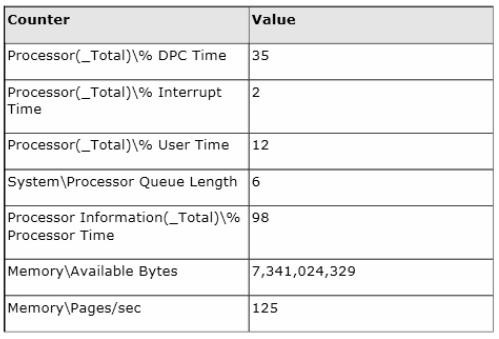
You need to identify the cause of the performance issue.
What should you identify?

A.
Insufficient processors
B.
Excessive paging
C.
Driver malfunction
D.
Insufficient RAM
Explanation:
Processor: %DPC Time. Much like the other values, this counter shows the amount of time that the processor
spends servicing DPC requests. DPC requests are more often than not associated with the network interface.
Processor: % Interrupt Time. This is the percentageof time that the processor is spending on handling
Interrupts. Generally, if this value exceeds 50% ofthe processor time you may have a hardware issue. Some
components on the computer can force this issue andnot really be a problem. For example a programmable I/
O card like an old disk controller card, can take up to 40% of the CPU time. A NIC on a busy IIS server can
likewise generate a large percentage of processor activity.
Processor: % User Time. The value of this counter helps to determine the kind of processing that is affecting
the system. Of course the resulting value is the total amount of non-idle time that was spent on User mode
operations. This generally means application code.
Processor: %Privilege Time. This is the amount of time the processor was busy with Kernel mode operations. If
the processor is very busy and this mode is high, it is usually an indication of some type of NT service having
difficulty, although user mode programs can make calls to the Kernel mode NT components to occasionally
cause this type of performance issue.
Memory: Pages/sac This value is often confused withPage Faults/sec. The Pages/sec counter is a
combination of Pages Input/sec and Pages Output/seccounters. Recall that Page Faults/sec is a combination
of hard page faults and soft page faults. This counter, however, is a general indicator of how often the system is
using the hard drive to store or retrieve memory associated data.
http://technet.microsoft.com/en-us/library/cc768048.aspx
I found that question on other sites having only those answers:
A. Excessive paging
B. NUMA fragmentation
C. Driver malfunction
D. Insufficient RAM
So the answer Insufficient processors was not an available answer!!!!
There, the correct was C, driver malfunction !!!
0
0
High cpu usage and high memory paging (even though RAM is available)
I’m with Catalina
C. driver malfunction.
0
0
It’s a new question and the answer is insufficient prossors.
The driver problem question had a 100% processor time and a interrupt time of 51 so be aware.
6
0
Thanks!
2
0
I think it is Driver Malfunction.
Processor\Interrupts/Sec:
This counter isolates hardware problems. What you are looking for huge increases, 2 or 3 magnitudes of interrupts, for no apparent reason. To resolve such hardware problems, start by asking if anyone has updated a driver recently.
http://www.computerperformance.co.uk/HealthCheck/Processor_Health.htm
0
0
beware, in the question where driver malfunction is the answer, interupts are at 51.
2
0
thanks
0
0
Thanks man!!!
0
0
You may have a CPU bottleneck if…
The value of the Processor\% Processor Time performance counter often exceeds 75%.
The value of the System\ Processor Queue Length performance counter is 2 or more for a sustained period of time.
The value of the Processor\% Privileged Time or System\Context Switches/sec performance counters are unusually high.
If the value of Processor\ % Processor Time performance counter is high, then queuing occurs, and in most scenarios the value of System\ Processor Queue Length will also be high.
0
0
Correct Answer is A
CPU Time at 98% is processor problem
DPC Time greater than 50% would be hardware malfunction
3
0
System : Processor Queue Length. Oddly enough, this processor counter shows up under the System object, but not without good reason. There is only 1 queue for tasks that need to go to the processor, even if there is more than one CPU. Thus, counter provides a measure of the instantaneous size of the queue for all processors at the moment that the measurement was taken. The resulting value is a measure of how many threads are in the Ready state waiting to be processed. When dealing with queues, if the value exceeds 2 for a sustained period, you are definitely having a problem with the resource in question.
https://technet.microsoft.com/en-us/library/cc768048.aspx
So: A
0
0
Correct answer is A
It clearly state that “CPU Time at 98%” which is a processor problem
For the OTHER similar question which answer is Driver malfunction.
It Exhibit show that DPC Time is greater than 50%.
My suggestion is dun study blindly pls!
0
0
A is correct
Processor: % Interrupt Time. This is the percentage of time that the processor is spending on handling Interrupts. Generally, if this value exceeds 50% of the processor time you may have a hardware issue. Some components on the computer can force this issue and not really be a problem. For example a programmable I/O card like an old disk controller card, can take up to 40% of the CPU time. A NIC on a busy IIS server can likewise generate a large percentage of processor activity.
Processor: % User Time. The value of this counter helps to determine the kind of processing that is affecting the system. Of course the resulting value is the total amount of non-idle time that was spent on User mode operations. This generally means application code.
Processor: %Privilege Time. This is the amount of time the processor was busy with Kernel mode operations. If the processor is very busy and this mode is high, it is usually an indication of some type of NT service having difficulty, although user mode programs can make calls to the Kernel mode NT components to occasionally cause this type of performance issue.
Memory: Pages/sec. This value is often confused with Page Faults/sec. The Pages/sec counter is a combination of Pages Input/sec and Pages Output/sec counters. Recall that Page Faults/sec is a combination of hard page faults and soft page faults. This counter, however, is a general indicator of how often the system is using the hard drive to store or retrieve memory associated data.
0
0