

Given: In a site survey deliverable report, you are expected to explain the spectrum measurements taken at
the customer’s site. The exhibit shows a representative sample capture of the RF environment at one of the
customer sites.
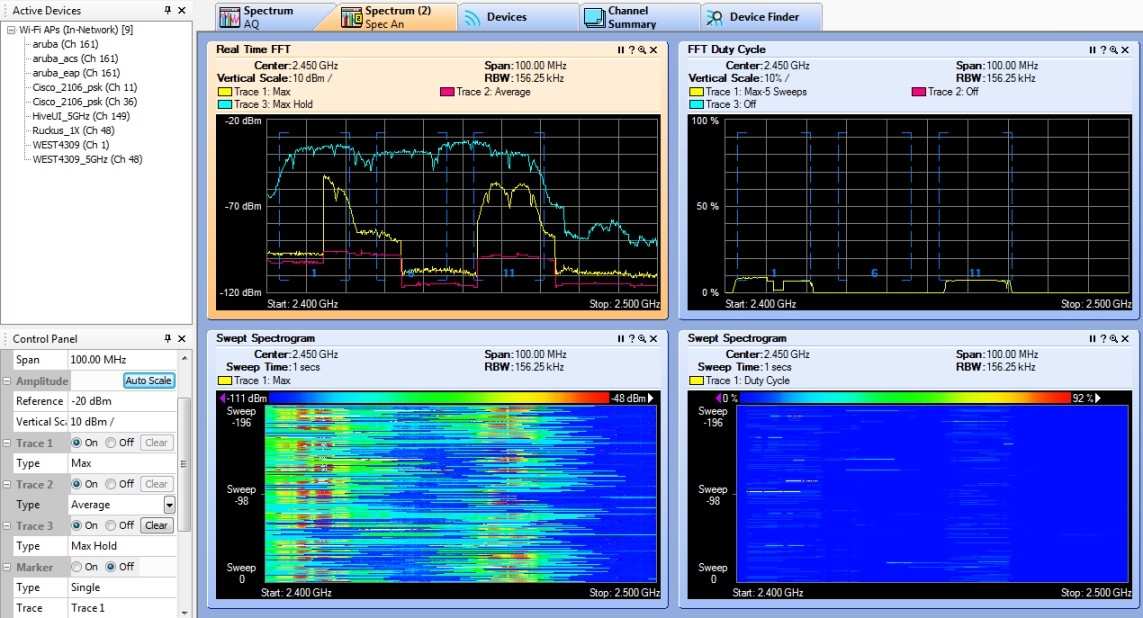
What best explains the data presented in this exhibit?

A.
The Real Time FFT chart shows a high noise floor across the entire 2.4 GHz band.
B.
Channel 1 is being heavily utilized by Wi-Fi and channel 11 also has some moderate Wi-Fi activity.
C.
As indicated by the data in the Active Devices list, the spectrum analysis chipset is also reporting 802.11
information.
D.
Although some access points are present in a nearby area, they are not being heavily used.