

You are developing a SQL Server Reporting Services (SSRS) report. The report includes a
dataset with fields named.
Year MonthNumber, and RegCount. The report includes a table that displays the number of
recorded registration occurrences per year,as shown in the following table.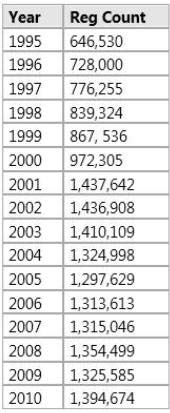
You need to modify the table to include a graphical item displaying the monthly registration
trend to the right of the Reg Count column.
What should you do?

A.
Add an Indicator item to a new column on the right of the Reg Count column. Select the
Directional Indicator Type and then assign the MonthNumber field to the Start property.
B.
Add an Indicator item to a new column on the right of the Reg Count column. Select the
Directional Indicator Type and then select the MonthNumber field for Value.
C.
Add a Sparkline item to a new column on the right of the Reg Count column. Then select
the RegCount field for Values and the MonthNumber field for Series Groups.
D.
Add a text box to a new column on the right of the Reg Count column. Then use a Go to
report action to link to a separate report showing the monthly trend.
E.
Add a Sparkline item to a new column on the right of the Reg Count column. Then select
the RegCount field for Values and the MonthNumber field for Category Groups.
Sparkline is great to show a mini chart. Here Month is Category Group and RegCount is Value
0
0
Answer is correct.
Category Group will define the horizontal axis (Month).
Series Group will define a line for each item (Year).
https://technet.microsoft.com/en-us/library/ff487483(v=sql.105).aspx
0
0