

You are developing a SQL Server Reporting Services (SSRS) report. The report includes a
dataset with fields namedYear Month Number, and InvCount. The report includes a table
that displays the inventory count per year, as shown in the following table.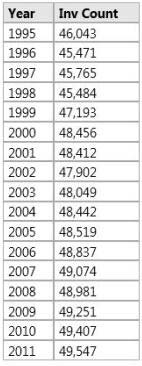
You need to modify the table to include a graphical item displaying the inventory count trend
to the right of the Inv Count column.
What should you do?

A.
Add an Indicator item to a new column on the right of the Inv Count column. Select the
Directional Indicator type and then assign the MonthNumber field to the Start property.
B.
Add a Sparkline item to a new column on the right of the Inv Count column. Then select
the InvCount field for Values and the MonthNumber field for Series Groups.
C.
Add a Sparkline item to a new column on the right of the Inv Count column. Then select
the InvCount field for Values and the MonthNumber field for Category Groups.
D.
Add a text box to a new column on the right of the Inv Count column. Then use a Go to
report action to link to a separate report showing the monthly trend.
E.
Add an Indicator item to a new column on the right of the Inv Count column. Select the
Directional Indicator type and then select the MonthNumber field for Value.
http://www.microsoft4shared.com/wp-content/uploads/2014/08/clip_image01312.jpg
0
0
Example
https://svangasql.wordpress.com/2011/11/14/how-to-add-sparkline-in-ssrs/
0
0
Sparkline / category groups
0
0
As far as I get it: an indicator is not used for trends.
0
0
C is correct
0
0