

You are creating a business report by using Microsoft Excel 2010. You have arranged sales data as shown below: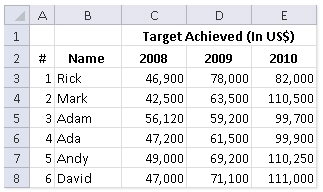
You want to provide pictorial representation of the trend of these sales data in front of each row.
Which of the following steps will you choose to accomplish the task involving the least amount of
administrative burden?

A.
Use sparklines.
B.
Use illustrations.
C.
Use conditional formatting.
D.
Use charts.
Explanation:
In order to accomplish the task with least amount of administrative burden, use sparklines.
Sparklines, introduced in Microsoft Office 2010, are tiny charts that can fit in a cell. The sparklines
can be used to show trends in a small amount of space. It visually summarizes trends alongside data.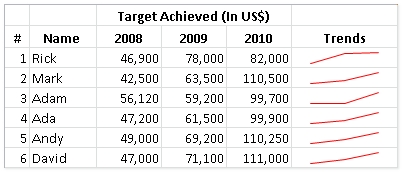
Sparklines can be used in places where users need to show a snapshot of their data in an easy-tounderstand visual format. Sparklines can be added through the Insert tab.
Answer D is incorrect. Charts will not provide the representation row-wise. Moreover, it will involve
lots of administrative burden.
Answer B is incorrect. Illustrations include pictures, smart objects, snapshots, etc. It cannot be used
to display trends.
Answer C is incorrect. A conditional format in Microsoft Excel is used to automatically format (e.g.,
change the font size or cell shading) a cell if a particular condition is true. It does not provide the
pictorial representation of trend.
