

DRAG DROP
You administer a Microsoft SQL Server database that is used by an application.
Users of the application report performance issues.
You need to choose the appropriate tool for performance-tuning of SQL Server databases.
Which tool or tools should you use? (To answer, drag the appropriate tool or tools to their
corresponding task or tasks in the answer are
A)
Each tool may be used once, more than once, or not at all. You may need to drag the split bar
between panes or scroll to view content.)


Answer: 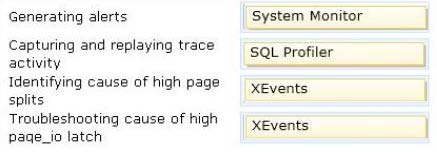
Explanation:
http://msdn.microsoft.com/enus/library/bb630282.aspx
http://msdn.microsoft.com/enus/library/ms191246.aspxhttp://msdn.microsoft.com/en-us/library/ms181091.aspx
This isn’t right, according to Transcender and others.
Alerts:
Extended events can not generate alerts
https://www.sqlskills.com/blogs/jonathan/event-notifications-vs-extended-events/
System Monitor can generate alerts
Sql Profiler can’t generate alerts
https://ask.sqlservercentral.com/questions/43471/sql-server-profiler-event-alerts.html
Only sql profiler trace and make traces that can be played back, so number 2 is right.
3 and 4 unbelievably is not xevents, its system monitor. So none of these answers is extended events. Here’s the transcender prose for a similar question. It’s in the last paragraph but the whole answer is worth reading:
SQL Server Profiler is a tool that provides a graphical user interface for monitoring an instance of the SQL Server Database Engine or
Analysis Service services. You can use SQL profiler to capture and replay trace files to troubleshoot many issues, including deadlock issues
and long running queries. SQL Server Profiler allows you to capture and save data about an event to a table or a file for analysis.
You should use DBCC CHECKDB to troubleshoot the integrity of objects in the Parts database. The DBCC CHECKDB statement checks
the logical and physical integrity of all the objects in a database because this statement performs the following operations:
Validates the Service Broker data in the database
Validates every indexed view in the database
Validates consistency between table metadata and file system when storing varbinary(max) data in the file system using
FILESTREAM
Runs DBCC CHECKALLOC, which checks the consistency of disk space allocation structures on the database
Runs DBCC CHECKTABLE, which checks the integrity of all the pages and structures of every table and view in the database
Runs DBCC CHECKCATALOG, which checks the catalog consistency on the database
Extended Events is an eventhandling
system for SQL Server 2008 R2 and SQL Server 2012 systems. Extended Events output from the
operating system or database applications is directed to Event Tracing for Windows (ETW) in order to correlate the event data with operating
system or application event data. Extended Events can be used to provide information for resolving issues involving:
Deadlock troubleshooting
High CPU usage troubleshooting
Finding the cause of working set trimming
Correlating request activity with Windows ETW logs
The sys.dm_exec_requests dynamic management view is used to determine the session IDs of the blocking sessions in the database. The
sys.dm_exec_requests view provides information about every request being executed on the SQL server. The columns in the view can be
used to determine details of the requests. The blocking_session_id column returns the session ID of the session that is blocking the request.
Other columns, such as wait_type and wait_time, can be used to determine the type of waits held and the duration of the waits in
milliseconds.
The sys.dm_exec_query_stats DMV provides aggregate performance data for cached query plans. This DMV can be used to gather
performance information, such as identifying the longestrunning
queries.
You can use System Monitor to troubleshoot high page splits and high page IO latch waits. You can use the SQLServer:Wait Statistics
performance object to find information about wait status, including NonPage
latch waits, Page IO latch waits, and Page latch waits. You
can use the SQLServer: Access Methods performance object to find information about page splits. This object will display the Page
Splits/sec that occur as the result of overflowing index pages and Page Deallocations/sec which are pages deallocated from memory that
occur on all databases in on the SQL Server instance
0
0
??????
0
0
Ive done more sleuthing.
Transcender, which costs $150 and is validated by MSFT is wrong
SQL:Server: Access Methods is a Performance Monitor item, not an extended event
Extended events has:
long_io detected and page_split.
So, transcender, who gets paid to do this, is wrong and this thing is right.
0
0
1 – 2 – 3 – 3
0
0
the correct answer is that it?
0
0
Answer is correct
http://www.aiotestking.com/microsoft/which-tool-or-tools-should-you-use-10/
0
0
Which is the right answer I’m confused
0
0
ensure pass says right answer is 1-1-2-2
0
0
1-2-3-3 is correct
0
0
You can use System Monitor to create an alert
https://msdn.microsoft.com/library/ms175166(v=sql.110).aspx
0
0
SQL Server Latches counters(System Monitor)
https://msdn.microsoft.com/library/ms177421(v=sql.110).aspx
0
0
exteneded events for latch
http://www.sqlservergeeks.com/sql-server-when-it-comes-to-lock-index-while-update/
0
0