

Mark the option/button in the following image of the Home tab on which you will click to convert the text of a
Mark the option/button in the following image of the Home tab on which you will click to convert
the text of a text box to a SmartArt graphic.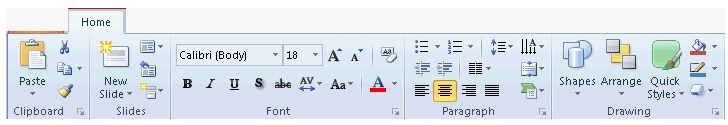
What is the most likely cause?
You work as a Sales Manager for Peach Tree Inc. Your responsibility includes creating sales reports of
the company. You create a report in a workbook in Excel 2010. The report contains a worksheet that
has been formatted by using the conditional formatting feature. You have specified five conditions
for conditional formatting of a list appearing in the sheet. You save the report and send it to your
manager. He informs you that the sheet on which conditional formatting feature is applied is not
appearing according to his requirement. He further specifies that only a few of the conditions are
applying. What is the most likely cause?
Which of the following will she use to resolve the issue?
Jasmine creates a presentation. She copies the presentation on a CD. However, the sound is not
playing on a different computer. Which of the following will she use to resolve the issue?
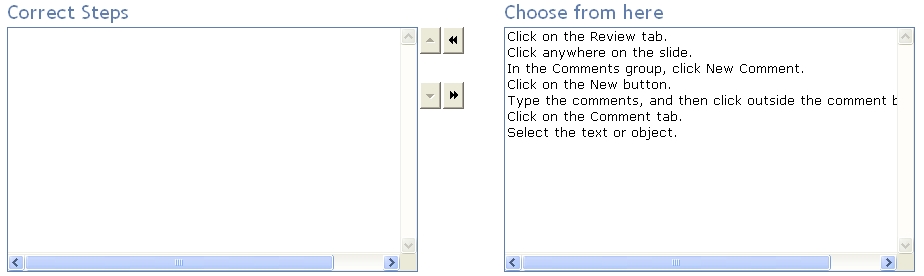
Choose and reorder the required steps to add a review comment to an object of a slide of a presentation as giv
Choose and reorder the required steps to add a review comment to an object of a slide of a
presentation as give below.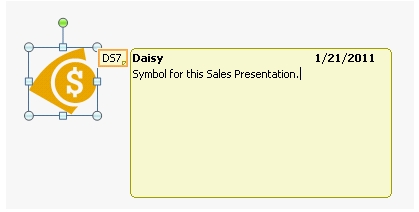
Mark the correct button that you will click to accomplish the task.
You work as an Office Assistant for OfficeWork Inc. You are creating a presentation through
PowerPoint 2010. This presentation is about your company’s new policy framework and contains
seven slides.
Now, you want to create a slide show for two departments named Marketing and Accounting. The
slide show named “Marketing Department” includes slides 1, 3, 5, and 7, and a second slide show
named “Accounting Department” includes slides 1, 2, 4, 5, and 6. You want to link these slide shows
with the primary presentation. Mark the correct button that you will click to accomplish the task.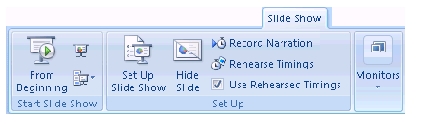
Which of the following steps will you take to accomplish the task?
You have created a sales report in Microsoft Excel 2010 as shown in the image below: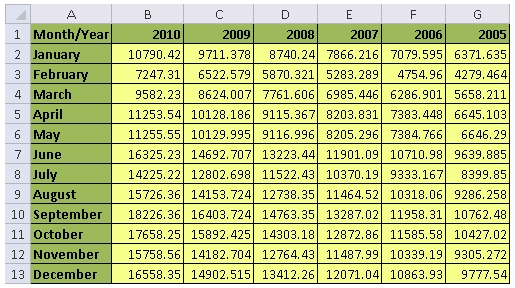
You need to sort the data in such a way that sales data for the year 2010 is listed in higher to lower
order. Which of the following steps will you take to accomplish the task?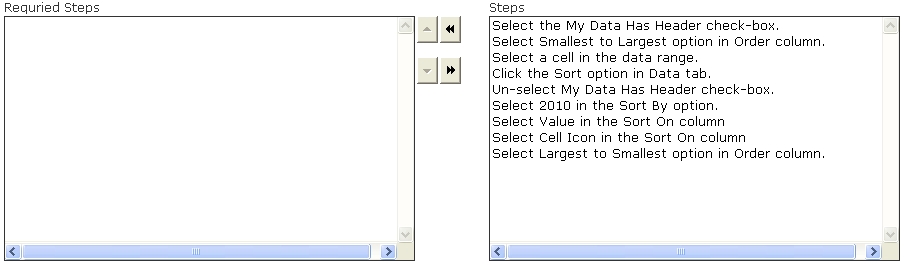
Choose the steps you will take to accomplish the task.
You have upgraded your Excel 2007 to Excel 2010. You want to personalize your Excel environment
through the Excel Options window given below: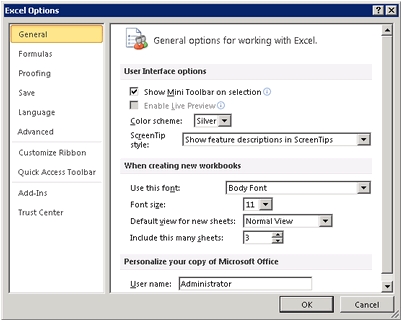
You are unable to find the Office button. Choose the steps you will take to accomplish the task.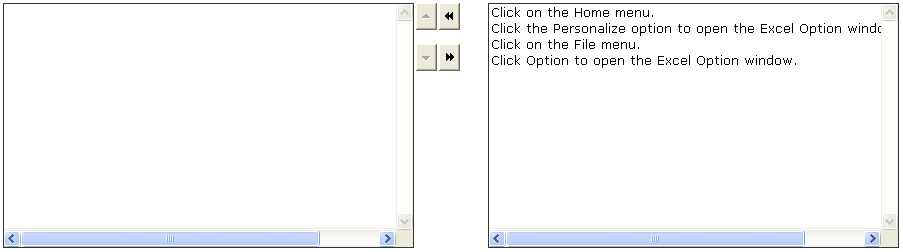
Which of the following steps will you take to accomplish the task?
You work as an Office Assistant for InfoTech Inc. You are creating a presentation named
ChemicalReaction.pptx in PowerPoint 2010. You have used the vertical equation SmartArt graphic
for describing the chemical reactions, and now you want to change the shape of the SmartArt
graphic in the slide in the following way: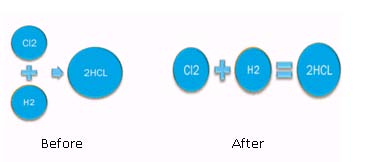
Which of the following steps will you take to accomplish the task?
Which of the following charts will you use to accomplish the task?
You work as an Office Assistant for Media Perfect Inc. You are creating a report in Microsoft Excel
2010. The report worksheet will include the sales made by all the sales managers in the month of January.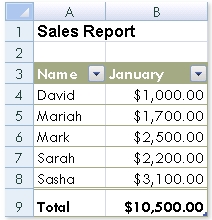
In the worksheet, you are required to place a pictorial representation displaying the percentage of
total sales made by each sales manager in January. Which of the following charts will you use to
accomplish the task?
Which of the following actions will you take to resolve the issue?
You work as an Office Assistant for Company Inc. You are creating a presentation by using the Slide
Master view. Now, you want to apply a hyperlink to the selected place holder text. However, you are
unable to hyperlink the text. Which of the following actions will you take to resolve the issue?