
why would an author use the Page Structure view?
In Report Studio, why would an author use the Page Structure view?
which report outputs can produce a bookmark?
In Report Studio, which report outputs can produce a bookmark?
what must an author create to let users view a report as either a list, a crosstab, or a chart?
In Report Studio, what must an author create to let users view a report as either a list, a crosstab,
or a chart?
What is the calculation in the last column?
In the image below,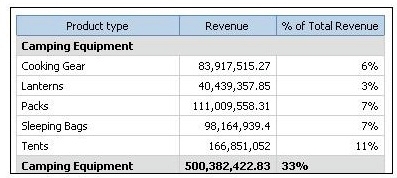
the last column calculates the percentage that each Product type contributed to the overall
revenue. What is the calculation in the last column?
Which of the following will add a page break for each Product Line?
In Report Studio, a query contains the data item Product Line, which is grouped. Which of the
following will add a page break for each Product Line?
How were these rows created?
The image below contains two rows of information above the column headers.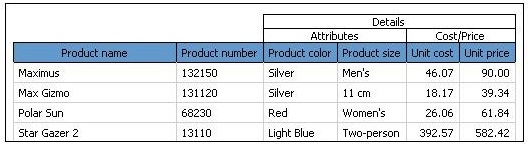
How were these rows created?
what can an author do to organize list data into logical sections?
In Report Studio, what can an author do to organize list data into logical sections?
How is each of the drill-throughs defined for this report to function as described?
In the report shown,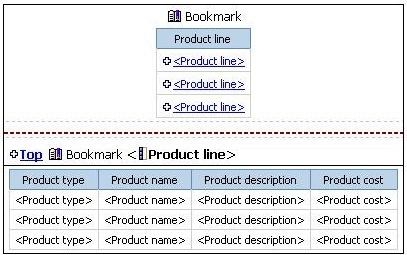
users click on the Product line link to navigate to the specific product line in the list below. Users
can also click on the Top link to return to the Product line list at the top of the report. Bookmarks
are used to control this drill-through behavior. How is each of the drill-throughs defined for this
report to function as described?
what will show how the report looks when it is generated?
In Report Studio, a report contains several blocks and tables. To determine if there is sufficient
space between objects, what will show how the report looks when it is generated?
What is the technique used to create this report?
In the report shown in the image,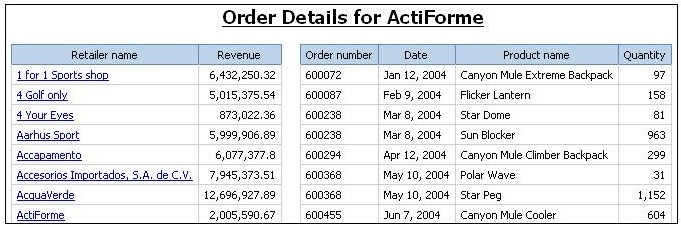
users click on the Retailer name in the left and see the related data on the right. What is the
technique used to create this report?