

Cluster Summary:
45 files and directories, 12 blocks = 57 total. Heap size is 15.31 MB/193.38MB(7%)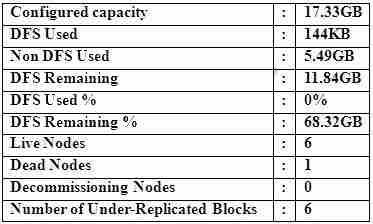
Refer to the above screenshot.
You configure a Hadoop cluster with seven DataNodes and on of your monitoring UIs displays the
details shown in the exhibit.
What does the this tell you?

A.
The DataNode JVM on one host is not active
B.
Because your under-replicated blocks count matches the Live Nodes, one node is dead, and
your DFS Used % equals 0%, you can’t be certain that your cluster has all the data you’ve written
it.
C.
Your cluster has lost all HDFS data which had bocks stored on the dead DatNode
D.
The HDFS cluster is in safe mode
correct answer is A
0
0
Why A please ? Thank you !
0
0
correct answer is A. Because one node is shown as dead meaning that it is not connected to namenode and NN won’t perform any writes to that DN. The command “hadoop dfsadmin -refrshNodes” might help bringing back the node to live.
0
0
this question seems bogus, dfs remaining % is in GB, hard to trust – what exactly is being asked.
0
0
Why would B not be the correct answer with the best explanation? We know that “one node is dead” from this display but we do not know exactly the cause. This is why I do not agree with “A”. Only “B” seems to have all correct statements.
0
0
“DFS Used %” is zero only because overall cluster usage is so low:
0.144MB (dfs used) / 17330MB (capacity) * 100 = 0,00080784766 %
0
0
What is the correct answer here? Thankx in advance.
0
0
A is correct one
0
0
A is wrong, the DataNode JVM on the datanode might be active,but the node can’t connect to the lan
0
0
A is wrong, the DataNode JVM on the dead node might be active,but the node can’t connect to the lan
0
0
A is the correct one, considering the options available.
0
0
A
0
0
B is the correct answer.Just got my result
0
0
Correct answer is B
0
0