

Refer to the Exhibit.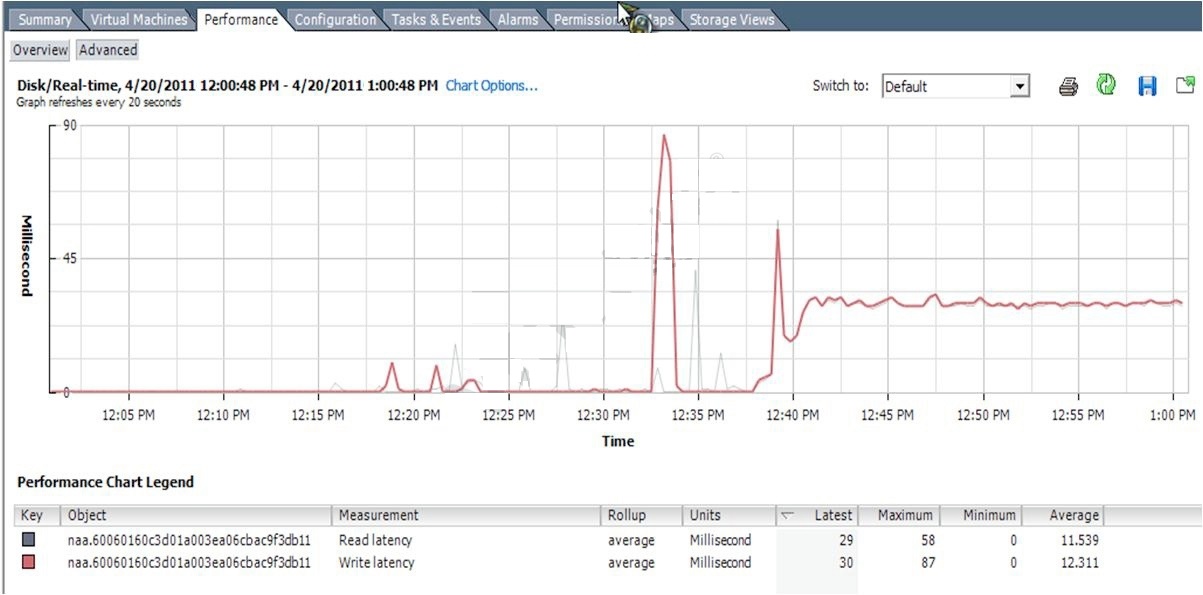
What does the graph in the exhibit indicate?

A.
The average amount of read and write latency from the ESXi host to the SAN.
B.
The average amount of read and write latency from the guest operating system to the virtual
machine virtual disk file.
C.
The average amount of read and write latency from the ESXi host to the datastore.
D.
The average amount of read and write latency from the cluster to the datastore.