Get 50% Discount on All Your Purchases at PrepAway.com - Latest Exam Questions This is ONE TIME OFFER 50% Enter your email address to receive your 50% off dicount code: A confirmation link will be sent to this email address to verify your login. GET YOUR DISCOUNT CODE * We value your privacy. We will not rent or sell your email address.
50% Enter your email address to receive your 50% off dicount code: A confirmation link will be sent to this email address to verify your login. GET YOUR DISCOUNT CODE * We value your privacy. We will not rent or sell your email address.
SPECIAL OFFER: GET 50% OFF 50% Use Discount Code: BRIEF50 A confirmation link was sent to your e-mail. Please check your mailbox for a message from support@prepaway.com and follow the directions. Shop Now
50% Use Discount Code: BRIEF50 A confirmation link was sent to your e-mail. Please check your mailbox for a message from support@prepaway.com and follow the directions. Shop Now
You have a Power Pivot model that includ… adminJanuary 30, 2019 You have a Power Pivot model that includes a KPI. You need to create a visualization based on the Power Pivot model as shown in the exhibit. (Click the Exhibit button.) 
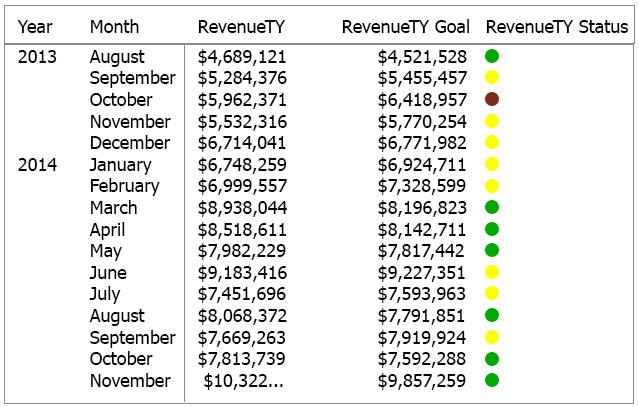
Which type of visualization should you use? A. matrix B. KPI C. multi row card D. table Show Answer
malkor says: April 23, 2020 at 10:35 am The question to me is saying how do you recreate that Power Pivot visual in Power BI (not just it’s KPI) so the answer is Matrix. https://docs.microsoft.com/en-us/power-bi/visuals/desktop-matrix-visual 4 0
The question to me is saying how do you recreate that Power Pivot visual in Power BI (not just it’s KPI) so the answer is Matrix.
https://docs.microsoft.com/en-us/power-bi/visuals/desktop-matrix-visual
4
0