

Click the Exhibit button.
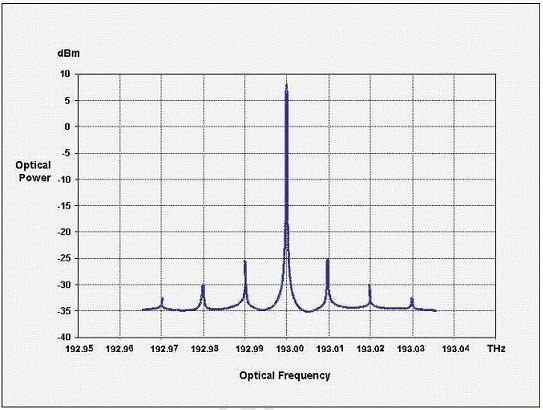
The exhibit represents a power to frequency graph of a modulated optical signal with a base frequency of 193.00 THz. What do the smaller peaks on each side of the base frequency represent?

A.
Pink noise of the transmitter
B.
Four-wave mixing products
C.
Modulation sidebands of the optical signal
D.
Other wavelengths in a DWDM system
E.
Gain tilt of wavelengths in a DWDM system