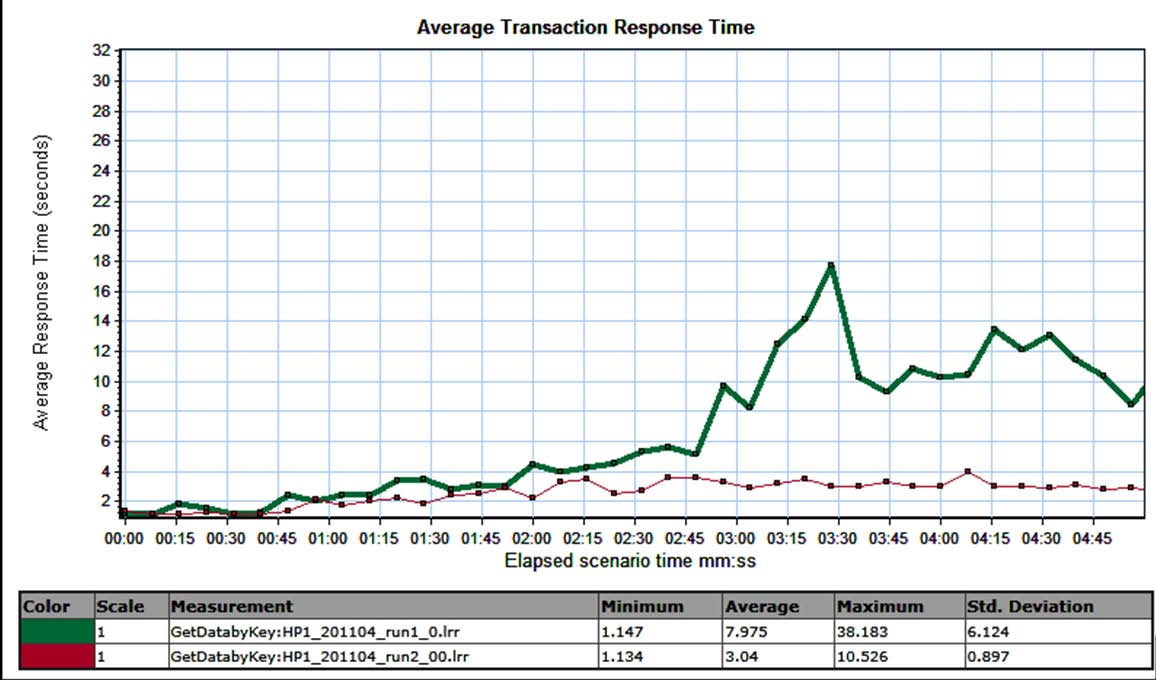
Which Analysis function was used to create the graph shown in the exhibit? seenagape 9 years ago Click the Exhibit button. Which Analysis function was used to create the graph shown in the exhibit? A.Cross-scenario Results B.Merge graph C.Auto Correlate D.Overlay ← Previous question Next question →