

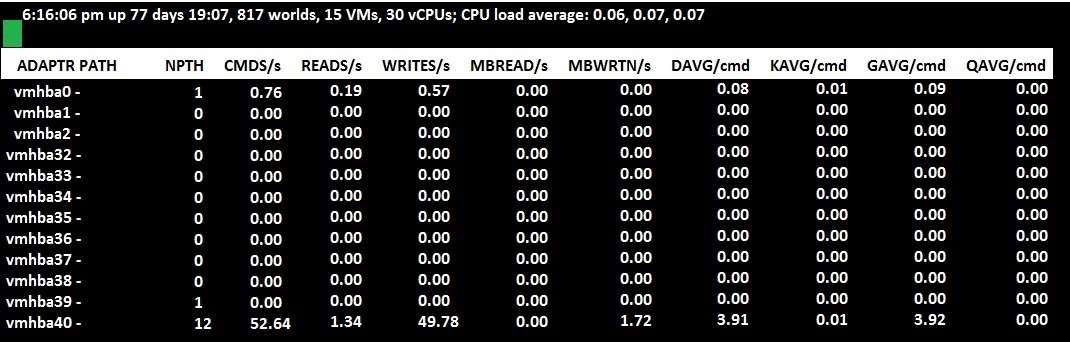
Which metric in the Exhibit would identify high latency for a storage device?

A.
QAVG/cmd
B.
KAVG/cmd
C.
DAVG/cmd
D.
GAVG/cmd
Explanation:
https://blogs.vmware.com/vsphere/2012/05/troubleshooting-storage-performance-in-vsphere-part-1-
the-basics.html
Correct C
https://docs.vmware.com/en/VMware-vSphere/6.5/com.vmware.vsphere.monitoring.doc/GUID-CE9B766E-573B-4FF6-9768-8AF315542348.html
5
0
C is correct.
DAVG/cmd – Average device latency per command, in milliseconds.
KAVG/cmd – Average ESXi VMkernel latency per command, in milliseconds.
GAVG/cmd – Average virtual machine operating system latency per command, in milliseconds.
QAVG/cmd – Average queue latency per command, in milliseconds.
2
0
I agree with C being the answer:
https://kb.vmware.com/s/article/1008205
CMDS/s:
This is the total amount of commands per second and includes IOPS (Input/Output Operations Per Second) and other SCSI commands such as SCSI reservations, locks, vendor string requests, unit attention commands etc. being sent to or coming from the device or virtual machine being monitored.
In most cases, CMDS/s = IOPS unless there are a lot of metadata operations (such as SCSI reservations)
DAVG/cmd:
This is the average response time in milliseconds per command being sent to the device.
KAVG/cmd:
This is the amount of time the command spends in the VMkernel.
GAVG/cmd:
This is the response time as it is perceived by the guest operating system. This number is calculated with the formula: DAVG + KAVG = GAVG
1
0