

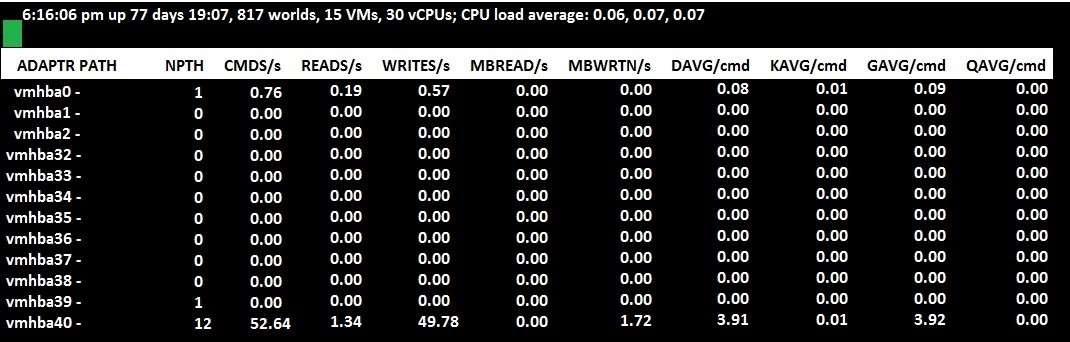
Which metric in the Exhibit would identify high latency for a storage device?

A.
QAVG/cmd
B.
KAVG/cmd
C.
DAVG/cmd
D.
GAVG/cmd
Explanation:
https://blogs.vmware.com/vsphere/2012/05/troubleshooting-storage-performance-in-vsphere-part-1-
the-basics.html
c
1
0
https://blogs.vmware.com/vsphere/2012/06/troubleshooting-storage-performance-in-vsphere-part-2.html
0
0
https://docs.vmware.com/en/VMware-vSphere/6.5/com.vmware.vsphere.monitoring.doc/GUID-CE9B766E-573B-4FF6-9768-8AF315542348.html
0
0
Poor storage performance is generally the result of high I/O latency
Make sure your Device Latency (DAVG) is less than that 20-30ms guidance
DAVG/cmd : Average device latency per command, in milliseconds.
KAVG/cmd : Average ESXi VMkernel latency per command, in milliseconds.
GAVG/cmd : Average virtual machine operating system latency per command, in milliseconds.
QAVG/cmd : Average queue latency per command, in milliseconds.
0
0
BTW, part of that new 125Q 2V0-622PSE dumps are available here:
https://drive.google.com/open?id=0B-ob6L_QjGLpaXhnQWQ4S2Ffc1k
Best Regards!
0
0
C
https://blogs.vmware.com/vsphere/2012/05/troubleshooting-storage-performance-in-vsphere-part-1-the-basics.html
0
0
https://blogs.vmware.com/vsphere/2012/05/troubleshooting-storage-performance-in-vsphere-part-1-the-basics.html
0
0