

You need to implement the date dimension in the Operations database
###BeginCaseStudy###
Case Study: 4
WingTip Toys
General Background
You are a data architect for WingTip Toys. The company uses SQL Server 2012 Enterprise
edition. SQL Server Analysis Services (SSAS) and SQL Server Reporting Services (SSRS)
are installed on separate servers.
Data Warehouse
The company’s data warehouse initially contained less than 100 MB and 100 million rows of
data from only one data source. It now contains more than 10 TB and 10 billion rows of data,
in 25 tables, from 12 data sources.
The largest table in the data warehouse, the factOrders table, contains 5 TB of data. The
factOrders table contains three date keys: OrderDateKey InvoiceDateKey, and ShipDateKey.
The data warehouse server has 1 TB of RAM. Memory usage is currently at 20 percent.
One billion rows of data are added to the data warehouse each month. New data is copied
each night from the data sources into SQL Server staging tables, and existing records are not
updated. The largest data set is order information, which is loaded in parallel into multiple
staging tables, one for each data source. All the staging tables have the same structure and
belong to the same filegroup as the factOrders table.
The dimCustomers table stores customer information that may change over time.
Data Models
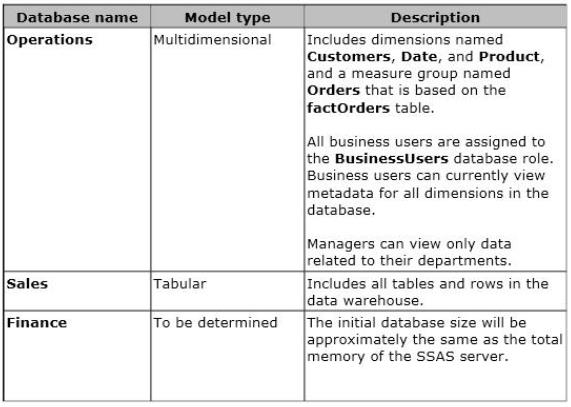
You are developing three SSAS databases, as described in the following table.
Reporting
Business users frequently generate reports in Microsoft Excel by using PowerPivot. The
PowerPivot Management Dashboard does not currently display any usage data.
Several SSRS reports exist that use the data warehouse as a source. The data warehouse
queries are aggregate queries that use the factOrders table and one or more dimension tables.
All SSRS data sources use Integrated Windows authentication.
SSRS displays a security access error message when managers run SSRS reports based on the
Operations database.
Reporting performance has become unacceptably slow.
Business Requirements
Improve the query speed of the SSRS reports.
Allow business users to create reports by using PowerPivot and Power View.
Ensure that all users other than business users can view metadata for the Customers
dimension. Ensure that business users cannot view metadata for the Customers dimension.
Technical Requirements
Modify the tables in the data warehouse to minimize aggregate query processing time.
Minimize disk storage in the data warehouse.
Ensure that all multidimensional models process data as quickly as possible.
Create a fact table named factCustomerContact in the data warehouse to store the contact
date, customer key, and communication type for each instance of customer contact.
Store the history of customer information changes in the dimCustomers table.
Move data from the staging tables into the factOrders table as quickly as possible. When
creating dimensions for the date keys in the factOrders table, minimize storage space
requirements and optimize the cube processing time.
Ensure that queries against the Sales database return the most current data in the data
warehouse.
Ensure that the SSAS model of the Finance database does not page to disk or return a
memory error as the size of the database grows.
Create an SSAS monitoring solution that tracks the following data:
• Queries answered per second
• Queries from cache direct per second
• Queries from file per second.
###EndCaseStudy###
You need to implement the date dimension in the Operations database.
What should you do?
Which four actions should you perform in sequence?
###BeginCaseStudy###
Case Study: 5
Contoso, Ltd Case B
General Background
You are the business intelligence (BI) solutions architect for Contoso, Ltd, an online retailer.
You produce solutions by using SQL Server 2012 Business Intelligence edition and
Microsoft SharePoint Server 2010 Service Pack 1 (SP1) Enterprise edition.
A SharePoint farm has been installed and configured for intranet access only. An Internetfacing web server hosts the company’s public e-commerce website. Anonymous access is not
configured on the Internet-facing web server.
Data Warehouse
The data warehouse is deployed on a 5QL Server 2012 relational database instance. The data
warehouse is structured as shown in the following diagram.
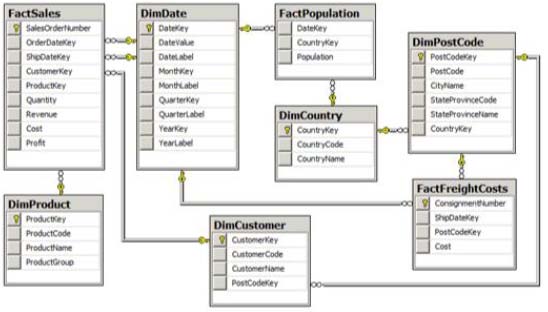
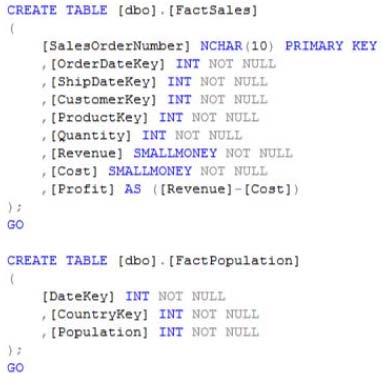
The following Transact-SQL (T-SQL) script is used to create the FactSales and
FactPopulation tables:
The FactPopulation table is loaded each year with data from a Windows Azure Marketplace
commercial dataset. The table contains a snapshot of the population values for all countries of
the world for each year. The world population for the last year loaded exceeds 6.8 billion
people.
ETL Process
SQL Server Integration Services (SSIS) is used to load data into the data warehouse. All SSIS
projects are developed by using the project deployment model.
A package named StageFactSales loads data into a data warehouse staging table. The package
sources its data from numerous CSV files exported from a mainframe system. The CSV file
names begin with the letters GLSD followed by a unique numeric identifier that never
exceeds six digits. The data content of each CSV file is identically formatted.
A package named LoadFactFreightCosts sources data from a Windows Azure SQL Database
database that has data integrity problems. The package may retrieve duplicate rows from the
database.
The package variables of all packages have the RaiseChangedEvent property set to true. A
package-level event handler for the OnVariableValueChanged event consists of an Execute
SQL task that logs the System::VariableName and System::VariableValue variables.
Data Models
SQL Server Analysis Services (SSAS) is used to host the Corporate BI multidimensional
database. The Corporate BI database contains a single data source view named Data
Warehouse. The Data Warehouse data source view consists of all data warehouse tables. All
data source view tables have been converted to named queries.
The Corporate BI database contains a single cube named Sales Analysis and three database
dimensions: Date, Customer and Product. The dimension usage for the Sales Analysis cube is
as shown in the following image.
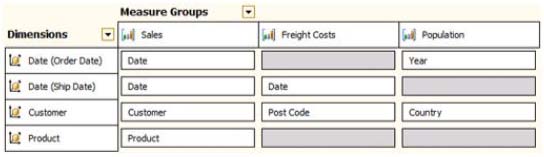
The Customer dimension contains a single multi-level hierarchy named Geography. The
structure of the Geography hierarchy is shown in the following image.
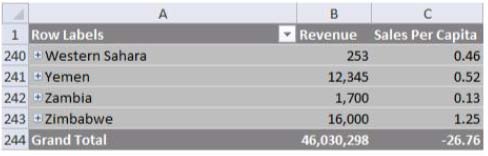
The Sales Analysis cube’s calculation script defines one calculated measure named Sales Per
Capit
a The calculated measure expression divides the Revenue measure by the Population
measure and multiplies the result by 1,000. This calculation represents revenue per 1,000
people.

The Sales Analysis cube produces correct Sales Per Capita results for each country of the
world; however, the Grand Total for all countries is incorrect, as shown in the following
image (rows 2-239 have been hidden).
A role named Analysts grants Read permission for the Sales Analysis cube to all sales and
marketing analysts in the company.
SQL Server Reporting Services (SSRS) is configured in SharePoint integrated mode. All
reports are based on shared data sources.
Corporate logo images used in reports were originally configured as data-bound images
sourced from a SQL Server relational database table. The image data has been exported to
JPG files. The image files are hosted on the Internet-facing web server. All reports have been
modified to reference the corporate logo images by using the fully qualified URLs of the
image files. A red X currently appears in place of the corporate logo in reports.
Users configure data alerts on certain reports. Users can view a report named Sales
Profitability on demand; however, notification email messages are no longer being sent when
Sales Profitability report data satisfies alert definition rules. The alert schedule settings for the
Sales Profitability report are configured as shown in the following image.

Business Requirements
Data Models
Users must be able to:
• Provide context to measures and filter measures by using all related data warehouse
dimensions.
• Analyze measures by order date or ship date.
Additionally, users must be able to add a measure named Sales to the report canvas by
clicking only once in the Power View field list. The Sales measure must allow users to
analyze the sum of the values in the Revenue column of the FactSales data warehouse table.
Users must be able to change the aggregation function of the Sales measure.
Analysis and Reporting
A sales manager has requested the following query results from the Sales Analysis cube for
the 2012 fiscal year:
• Australian postal codes and sales in descending order of sales.
• Australian states and the ratio of sales achieved by the 10 highest customer sales made
for each city in that state.
Technical Requirements
ETL Processes
If an SSIS package variable value changes, the package must log the variable name and the
new variable value to a custom log table.
The StageFactSales package must load the contents of all files that match the file name
pattern. The source file name must also be stored in a column of the data warehouse staging
table.
In the design of the LoadFactSales package, if a lookup of the dimension surrogate key value
for the product code fails, the row details must be emailed to the data steward and written as
an error message to the SSIS catalog log by using the public API.
You must configure the LoadFactFreightCosts package to remove duplicate rows, by using
the least development effort.
Data Models
Users of the Sales Analysis cube frequently filter on the current month’s data. You must
ensure that queries to the Sales Analysis cube default to the current month in the Order Date
dimension for all users.
You must develop and deploy a tabular project for the exclusive use as a Power View
reporting data source. The model must be based on the data warehouse. Model table names
must exclude the Dim or Fact prefixes. All measures in the model must format values to
display zero decimal places.
Analysis and Reporting
Reports must be developed that combine the SSIS catalog log messages with the package
variable value changes.
###EndCaseStudy###
DRAG DROP
You need to implement the requirements for the StageFactSales package.
Which four actions should you perform in sequence? (To answer, move the appropriate
actions from the list of actions to the answer area and arrange them in the correct order.)

Which Multidimensional Expressions (MDX) calculation should you use to complete the query?
###BeginCaseStudy###
Case Study: 5
Contoso, Ltd Case B
General Background
You are the business intelligence (BI) solutions architect for Contoso, Ltd, an online retailer.
You produce solutions by using SQL Server 2012 Business Intelligence edition and
Microsoft SharePoint Server 2010 Service Pack 1 (SP1) Enterprise edition.
A SharePoint farm has been installed and configured for intranet access only. An Internetfacing web server hosts the company’s public e-commerce website. Anonymous access is not
configured on the Internet-facing web server.
Data Warehouse
The data warehouse is deployed on a 5QL Server 2012 relational database instance. The data
warehouse is structured as shown in the following diagram.
The following Transact-SQL (T-SQL) script is used to create the FactSales and
FactPopulation tables:
The FactPopulation table is loaded each year with data from a Windows Azure Marketplace
commercial dataset. The table contains a snapshot of the population values for all countries of
the world for each year. The world population for the last year loaded exceeds 6.8 billion
people.
ETL Process
SQL Server Integration Services (SSIS) is used to load data into the data warehouse. All SSIS
projects are developed by using the project deployment model.
A package named StageFactSales loads data into a data warehouse staging table. The package
sources its data from numerous CSV files exported from a mainframe system. The CSV file
names begin with the letters GLSD followed by a unique numeric identifier that never
exceeds six digits. The data content of each CSV file is identically formatted.
A package named LoadFactFreightCosts sources data from a Windows Azure SQL Database
database that has data integrity problems. The package may retrieve duplicate rows from the
database.
The package variables of all packages have the RaiseChangedEvent property set to true. A
package-level event handler for the OnVariableValueChanged event consists of an Execute
SQL task that logs the System::VariableName and System::VariableValue variables.
Data Models
SQL Server Analysis Services (SSAS) is used to host the Corporate BI multidimensional
database. The Corporate BI database contains a single data source view named Data
Warehouse. The Data Warehouse data source view consists of all data warehouse tables. All
data source view tables have been converted to named queries.
The Corporate BI database contains a single cube named Sales Analysis and three database
dimensions: Date, Customer and Product. The dimension usage for the Sales Analysis cube is
as shown in the following image.
The Customer dimension contains a single multi-level hierarchy named Geography. The
structure of the Geography hierarchy is shown in the following image.
The Sales Analysis cube’s calculation script defines one calculated measure named Sales Per
Capit
a The calculated measure expression divides the Revenue measure by the Population
measure and multiplies the result by 1,000. This calculation represents revenue per 1,000
people.
The Sales Analysis cube produces correct Sales Per Capita results for each country of the
world; however, the Grand Total for all countries is incorrect, as shown in the following
image (rows 2-239 have been hidden).
A role named Analysts grants Read permission for the Sales Analysis cube to all sales and
marketing analysts in the company.
SQL Server Reporting Services (SSRS) is configured in SharePoint integrated mode. All
reports are based on shared data sources.
Corporate logo images used in reports were originally configured as data-bound images
sourced from a SQL Server relational database table. The image data has been exported to
JPG files. The image files are hosted on the Internet-facing web server. All reports have been
modified to reference the corporate logo images by using the fully qualified URLs of the
image files. A red X currently appears in place of the corporate logo in reports.
Users configure data alerts on certain reports. Users can view a report named Sales
Profitability on demand; however, notification email messages are no longer being sent when
Sales Profitability report data satisfies alert definition rules. The alert schedule settings for the
Sales Profitability report are configured as shown in the following image.
Business Requirements
Data Models
Users must be able to:
• Provide context to measures and filter measures by using all related data warehouse
dimensions.
• Analyze measures by order date or ship date.
Additionally, users must be able to add a measure named Sales to the report canvas by
clicking only once in the Power View field list. The Sales measure must allow users to
analyze the sum of the values in the Revenue column of the FactSales data warehouse table.
Users must be able to change the aggregation function of the Sales measure.
Analysis and Reporting
A sales manager has requested the following query results from the Sales Analysis cube for
the 2012 fiscal year:
• Australian postal codes and sales in descending order of sales.
• Australian states and the ratio of sales achieved by the 10 highest customer sales made
for each city in that state.
Technical Requirements
ETL Processes
If an SSIS package variable value changes, the package must log the variable name and the
new variable value to a custom log table.
The StageFactSales package must load the contents of all files that match the file name
pattern. The source file name must also be stored in a column of the data warehouse staging
table.
In the design of the LoadFactSales package, if a lookup of the dimension surrogate key value
for the product code fails, the row details must be emailed to the data steward and written as
an error message to the SSIS catalog log by using the public API.
You must configure the LoadFactFreightCosts package to remove duplicate rows, by using
the least development effort.
Data Models
Users of the Sales Analysis cube frequently filter on the current month’s data. You must
ensure that queries to the Sales Analysis cube default to the current month in the Order Date
dimension for all users.
You must develop and deploy a tabular project for the exclusive use as a Power View
reporting data source. The model must be based on the data warehouse. Model table names
must exclude the Dim or Fact prefixes. All measures in the model must format values to
display zero decimal places.
Analysis and Reporting
Reports must be developed that combine the SSIS catalog log messages with the package
variable value changes.
###EndCaseStudy###
DRAG DROP
You are creating the Australian states query.
Which Multidimensional Expressions (MDX) calculation should you use to complete the
query?
To answer, drag the appropriate calculation to the answer area.

You need to ensure that the Sales Per Capita calculated measure produces correct results
###BeginCaseStudy###
Case Study: 5
Contoso, Ltd Case B
General Background
You are the business intelligence (BI) solutions architect for Contoso, Ltd, an online retailer.
You produce solutions by using SQL Server 2012 Business Intelligence edition and
Microsoft SharePoint Server 2010 Service Pack 1 (SP1) Enterprise edition.
A SharePoint farm has been installed and configured for intranet access only. An Internetfacing web server hosts the company’s public e-commerce website. Anonymous access is not
configured on the Internet-facing web server.
Data Warehouse
The data warehouse is deployed on a 5QL Server 2012 relational database instance. The data
warehouse is structured as shown in the following diagram.
The following Transact-SQL (T-SQL) script is used to create the FactSales and
FactPopulation tables:
The FactPopulation table is loaded each year with data from a Windows Azure Marketplace
commercial dataset. The table contains a snapshot of the population values for all countries of
the world for each year. The world population for the last year loaded exceeds 6.8 billion
people.
ETL Process
SQL Server Integration Services (SSIS) is used to load data into the data warehouse. All SSIS
projects are developed by using the project deployment model.
A package named StageFactSales loads data into a data warehouse staging table. The package
sources its data from numerous CSV files exported from a mainframe system. The CSV file
names begin with the letters GLSD followed by a unique numeric identifier that never
exceeds six digits. The data content of each CSV file is identically formatted.
A package named LoadFactFreightCosts sources data from a Windows Azure SQL Database
database that has data integrity problems. The package may retrieve duplicate rows from the
database.
The package variables of all packages have the RaiseChangedEvent property set to true. A
package-level event handler for the OnVariableValueChanged event consists of an Execute
SQL task that logs the System::VariableName and System::VariableValue variables.
Data Models
SQL Server Analysis Services (SSAS) is used to host the Corporate BI multidimensional
database. The Corporate BI database contains a single data source view named Data
Warehouse. The Data Warehouse data source view consists of all data warehouse tables. All
data source view tables have been converted to named queries.
The Corporate BI database contains a single cube named Sales Analysis and three database
dimensions: Date, Customer and Product. The dimension usage for the Sales Analysis cube is
as shown in the following image.
The Customer dimension contains a single multi-level hierarchy named Geography. The
structure of the Geography hierarchy is shown in the following image.
The Sales Analysis cube’s calculation script defines one calculated measure named Sales Per
Capit
a The calculated measure expression divides the Revenue measure by the Population
measure and multiplies the result by 1,000. This calculation represents revenue per 1,000
people.
The Sales Analysis cube produces correct Sales Per Capita results for each country of the
world; however, the Grand Total for all countries is incorrect, as shown in the following
image (rows 2-239 have been hidden).
A role named Analysts grants Read permission for the Sales Analysis cube to all sales and
marketing analysts in the company.
SQL Server Reporting Services (SSRS) is configured in SharePoint integrated mode. All
reports are based on shared data sources.
Corporate logo images used in reports were originally configured as data-bound images
sourced from a SQL Server relational database table. The image data has been exported to
JPG files. The image files are hosted on the Internet-facing web server. All reports have been
modified to reference the corporate logo images by using the fully qualified URLs of the
image files. A red X currently appears in place of the corporate logo in reports.
Users configure data alerts on certain reports. Users can view a report named Sales
Profitability on demand; however, notification email messages are no longer being sent when
Sales Profitability report data satisfies alert definition rules. The alert schedule settings for the
Sales Profitability report are configured as shown in the following image.
Business Requirements
Data Models
Users must be able to:
• Provide context to measures and filter measures by using all related data warehouse
dimensions.
• Analyze measures by order date or ship date.
Additionally, users must be able to add a measure named Sales to the report canvas by
clicking only once in the Power View field list. The Sales measure must allow users to
analyze the sum of the values in the Revenue column of the FactSales data warehouse table.
Users must be able to change the aggregation function of the Sales measure.
Analysis and Reporting
A sales manager has requested the following query results from the Sales Analysis cube for
the 2012 fiscal year:
• Australian postal codes and sales in descending order of sales.
• Australian states and the ratio of sales achieved by the 10 highest customer sales made
for each city in that state.
Technical Requirements
ETL Processes
If an SSIS package variable value changes, the package must log the variable name and the
new variable value to a custom log table.
The StageFactSales package must load the contents of all files that match the file name
pattern. The source file name must also be stored in a column of the data warehouse staging
table.
In the design of the LoadFactSales package, if a lookup of the dimension surrogate key value
for the product code fails, the row details must be emailed to the data steward and written as
an error message to the SSIS catalog log by using the public API.
You must configure the LoadFactFreightCosts package to remove duplicate rows, by using
the least development effort.
Data Models
Users of the Sales Analysis cube frequently filter on the current month’s data. You must
ensure that queries to the Sales Analysis cube default to the current month in the Order Date
dimension for all users.
You must develop and deploy a tabular project for the exclusive use as a Power View
reporting data source. The model must be based on the data warehouse. Model table names
must exclude the Dim or Fact prefixes. All measures in the model must format values to
display zero decimal places.
Analysis and Reporting
Reports must be developed that combine the SSIS catalog log messages with the package
variable value changes.
###EndCaseStudy###
You need to ensure that the Sales Per Capita calculated measure produces correct results.
What should you do?
Which components should you use?
###BeginCaseStudy###
Case Study: 5
Contoso, Ltd Case B
General Background
You are the business intelligence (BI) solutions architect for Contoso, Ltd, an online retailer.
You produce solutions by using SQL Server 2012 Business Intelligence edition and
Microsoft SharePoint Server 2010 Service Pack 1 (SP1) Enterprise edition.
A SharePoint farm has been installed and configured for intranet access only. An Internetfacing web server hosts the company’s public e-commerce website. Anonymous access is not
configured on the Internet-facing web server.
Data Warehouse
The data warehouse is deployed on a 5QL Server 2012 relational database instance. The data
warehouse is structured as shown in the following diagram.
The following Transact-SQL (T-SQL) script is used to create the FactSales and
FactPopulation tables:
The FactPopulation table is loaded each year with data from a Windows Azure Marketplace
commercial dataset. The table contains a snapshot of the population values for all countries of
the world for each year. The world population for the last year loaded exceeds 6.8 billion
people.
ETL Process
SQL Server Integration Services (SSIS) is used to load data into the data warehouse. All SSIS
projects are developed by using the project deployment model.
A package named StageFactSales loads data into a data warehouse staging table. The package
sources its data from numerous CSV files exported from a mainframe system. The CSV file
names begin with the letters GLSD followed by a unique numeric identifier that never
exceeds six digits. The data content of each CSV file is identically formatted.
A package named LoadFactFreightCosts sources data from a Windows Azure SQL Database
database that has data integrity problems. The package may retrieve duplicate rows from the
database.
The package variables of all packages have the RaiseChangedEvent property set to true. A
package-level event handler for the OnVariableValueChanged event consists of an Execute
SQL task that logs the System::VariableName and System::VariableValue variables.
Data Models
SQL Server Analysis Services (SSAS) is used to host the Corporate BI multidimensional
database. The Corporate BI database contains a single data source view named Data
Warehouse. The Data Warehouse data source view consists of all data warehouse tables. All
data source view tables have been converted to named queries.
The Corporate BI database contains a single cube named Sales Analysis and three database
dimensions: Date, Customer and Product. The dimension usage for the Sales Analysis cube is
as shown in the following image.
The Customer dimension contains a single multi-level hierarchy named Geography. The
structure of the Geography hierarchy is shown in the following image.
The Sales Analysis cube’s calculation script defines one calculated measure named Sales Per
Capit
a The calculated measure expression divides the Revenue measure by the Population
measure and multiplies the result by 1,000. This calculation represents revenue per 1,000
people.
The Sales Analysis cube produces correct Sales Per Capita results for each country of the
world; however, the Grand Total for all countries is incorrect, as shown in the following
image (rows 2-239 have been hidden).
A role named Analysts grants Read permission for the Sales Analysis cube to all sales and
marketing analysts in the company.
SQL Server Reporting Services (SSRS) is configured in SharePoint integrated mode. All
reports are based on shared data sources.
Corporate logo images used in reports were originally configured as data-bound images
sourced from a SQL Server relational database table. The image data has been exported to
JPG files. The image files are hosted on the Internet-facing web server. All reports have been
modified to reference the corporate logo images by using the fully qualified URLs of the
image files. A red X currently appears in place of the corporate logo in reports.
Users configure data alerts on certain reports. Users can view a report named Sales
Profitability on demand; however, notification email messages are no longer being sent when
Sales Profitability report data satisfies alert definition rules. The alert schedule settings for the
Sales Profitability report are configured as shown in the following image.
Business Requirements
Data Models
Users must be able to:
• Provide context to measures and filter measures by using all related data warehouse
dimensions.
• Analyze measures by order date or ship date.
Additionally, users must be able to add a measure named Sales to the report canvas by
clicking only once in the Power View field list. The Sales measure must allow users to
analyze the sum of the values in the Revenue column of the FactSales data warehouse table.
Users must be able to change the aggregation function of the Sales measure.
Analysis and Reporting
A sales manager has requested the following query results from the Sales Analysis cube for
the 2012 fiscal year:
• Australian postal codes and sales in descending order of sales.
• Australian states and the ratio of sales achieved by the 10 highest customer sales made
for each city in that state.
Technical Requirements
ETL Processes
If an SSIS package variable value changes, the package must log the variable name and the
new variable value to a custom log table.
The StageFactSales package must load the contents of all files that match the file name
pattern. The source file name must also be stored in a column of the data warehouse staging
table.
In the design of the LoadFactSales package, if a lookup of the dimension surrogate key value
for the product code fails, the row details must be emailed to the data steward and written as
an error message to the SSIS catalog log by using the public API.
You must configure the LoadFactFreightCosts package to remove duplicate rows, by using
the least development effort.
Data Models
Users of the Sales Analysis cube frequently filter on the current month’s data. You must
ensure that queries to the Sales Analysis cube default to the current month in the Order Date
dimension for all users.
You must develop and deploy a tabular project for the exclusive use as a Power View
reporting data source. The model must be based on the data warehouse. Model table names
must exclude the Dim or Fact prefixes. All measures in the model must format values to
display zero decimal places.
Analysis and Reporting
Reports must be developed that combine the SSIS catalog log messages with the package
variable value changes.
###EndCaseStudy###
DRAG DROP
You need to develop the LoadFactSales package to write the error messages to the SSIS
catalog log.
Which components should you use?
To answer, drag the appropriate components to the correct location or locations in the
answer area. (Use only components that apply.)

You need to ensure that the corporate logos appear in reports
###BeginCaseStudy###
Case Study: 5
Contoso, Ltd Case B
General Background
You are the business intelligence (BI) solutions architect for Contoso, Ltd, an online retailer.
You produce solutions by using SQL Server 2012 Business Intelligence edition and
Microsoft SharePoint Server 2010 Service Pack 1 (SP1) Enterprise edition.
A SharePoint farm has been installed and configured for intranet access only. An Internetfacing web server hosts the company’s public e-commerce website. Anonymous access is not
configured on the Internet-facing web server.
Data Warehouse
The data warehouse is deployed on a 5QL Server 2012 relational database instance. The data
warehouse is structured as shown in the following diagram.
The following Transact-SQL (T-SQL) script is used to create the FactSales and
FactPopulation tables:
The FactPopulation table is loaded each year with data from a Windows Azure Marketplace
commercial dataset. The table contains a snapshot of the population values for all countries of
the world for each year. The world population for the last year loaded exceeds 6.8 billion
people.
ETL Process
SQL Server Integration Services (SSIS) is used to load data into the data warehouse. All SSIS
projects are developed by using the project deployment model.
A package named StageFactSales loads data into a data warehouse staging table. The package
sources its data from numerous CSV files exported from a mainframe system. The CSV file
names begin with the letters GLSD followed by a unique numeric identifier that never
exceeds six digits. The data content of each CSV file is identically formatted.
A package named LoadFactFreightCosts sources data from a Windows Azure SQL Database
database that has data integrity problems. The package may retrieve duplicate rows from the
database.
The package variables of all packages have the RaiseChangedEvent property set to true. A
package-level event handler for the OnVariableValueChanged event consists of an Execute
SQL task that logs the System::VariableName and System::VariableValue variables.
Data Models
SQL Server Analysis Services (SSAS) is used to host the Corporate BI multidimensional
database. The Corporate BI database contains a single data source view named Data
Warehouse. The Data Warehouse data source view consists of all data warehouse tables. All
data source view tables have been converted to named queries.
The Corporate BI database contains a single cube named Sales Analysis and three database
dimensions: Date, Customer and Product. The dimension usage for the Sales Analysis cube is
as shown in the following image.
The Customer dimension contains a single multi-level hierarchy named Geography. The
structure of the Geography hierarchy is shown in the following image.
The Sales Analysis cube’s calculation script defines one calculated measure named Sales Per
Capit
a The calculated measure expression divides the Revenue measure by the Population
measure and multiplies the result by 1,000. This calculation represents revenue per 1,000
people.
The Sales Analysis cube produces correct Sales Per Capita results for each country of the
world; however, the Grand Total for all countries is incorrect, as shown in the following
image (rows 2-239 have been hidden).
A role named Analysts grants Read permission for the Sales Analysis cube to all sales and
marketing analysts in the company.
SQL Server Reporting Services (SSRS) is configured in SharePoint integrated mode. All
reports are based on shared data sources.
Corporate logo images used in reports were originally configured as data-bound images
sourced from a SQL Server relational database table. The image data has been exported to
JPG files. The image files are hosted on the Internet-facing web server. All reports have been
modified to reference the corporate logo images by using the fully qualified URLs of the
image files. A red X currently appears in place of the corporate logo in reports.
Users configure data alerts on certain reports. Users can view a report named Sales
Profitability on demand; however, notification email messages are no longer being sent when
Sales Profitability report data satisfies alert definition rules. The alert schedule settings for the
Sales Profitability report are configured as shown in the following image.
Business Requirements
Data Models
Users must be able to:
• Provide context to measures and filter measures by using all related data warehouse
dimensions.
• Analyze measures by order date or ship date.
Additionally, users must be able to add a measure named Sales to the report canvas by
clicking only once in the Power View field list. The Sales measure must allow users to
analyze the sum of the values in the Revenue column of the FactSales data warehouse table.
Users must be able to change the aggregation function of the Sales measure.
Analysis and Reporting
A sales manager has requested the following query results from the Sales Analysis cube for
the 2012 fiscal year:
• Australian postal codes and sales in descending order of sales.
• Australian states and the ratio of sales achieved by the 10 highest customer sales made
for each city in that state.
Technical Requirements
ETL Processes
If an SSIS package variable value changes, the package must log the variable name and the
new variable value to a custom log table.
The StageFactSales package must load the contents of all files that match the file name
pattern. The source file name must also be stored in a column of the data warehouse staging
table.
In the design of the LoadFactSales package, if a lookup of the dimension surrogate key value
for the product code fails, the row details must be emailed to the data steward and written as
an error message to the SSIS catalog log by using the public API.
You must configure the LoadFactFreightCosts package to remove duplicate rows, by using
the least development effort.
Data Models
Users of the Sales Analysis cube frequently filter on the current month’s data. You must
ensure that queries to the Sales Analysis cube default to the current month in the Order Date
dimension for all users.
You must develop and deploy a tabular project for the exclusive use as a Power View
reporting data source. The model must be based on the data warehouse. Model table names
must exclude the Dim or Fact prefixes. All measures in the model must format values to
display zero decimal places.
Analysis and Reporting
Reports must be developed that combine the SSIS catalog log messages with the package
variable value changes.
###EndCaseStudy###
You need to ensure that the corporate logos appear in reports.
What should you do?
Which data flow component should you use?
###BeginCaseStudy###
Case Study: 5
Contoso, Ltd Case B
General Background
You are the business intelligence (BI) solutions architect for Contoso, Ltd, an online retailer.
You produce solutions by using SQL Server 2012 Business Intelligence edition and
Microsoft SharePoint Server 2010 Service Pack 1 (SP1) Enterprise edition.
A SharePoint farm has been installed and configured for intranet access only. An Internetfacing web server hosts the company’s public e-commerce website. Anonymous access is not
configured on the Internet-facing web server.
Data Warehouse
The data warehouse is deployed on a 5QL Server 2012 relational database instance. The data
warehouse is structured as shown in the following diagram.
The following Transact-SQL (T-SQL) script is used to create the FactSales and
FactPopulation tables:
The FactPopulation table is loaded each year with data from a Windows Azure Marketplace
commercial dataset. The table contains a snapshot of the population values for all countries of
the world for each year. The world population for the last year loaded exceeds 6.8 billion
people.
ETL Process
SQL Server Integration Services (SSIS) is used to load data into the data warehouse. All SSIS
projects are developed by using the project deployment model.
A package named StageFactSales loads data into a data warehouse staging table. The package
sources its data from numerous CSV files exported from a mainframe system. The CSV file
names begin with the letters GLSD followed by a unique numeric identifier that never
exceeds six digits. The data content of each CSV file is identically formatted.
A package named LoadFactFreightCosts sources data from a Windows Azure SQL Database
database that has data integrity problems. The package may retrieve duplicate rows from the
database.
The package variables of all packages have the RaiseChangedEvent property set to true. A
package-level event handler for the OnVariableValueChanged event consists of an Execute
SQL task that logs the System::VariableName and System::VariableValue variables.
Data Models
SQL Server Analysis Services (SSAS) is used to host the Corporate BI multidimensional
database. The Corporate BI database contains a single data source view named Data
Warehouse. The Data Warehouse data source view consists of all data warehouse tables. All
data source view tables have been converted to named queries.
The Corporate BI database contains a single cube named Sales Analysis and three database
dimensions: Date, Customer and Product. The dimension usage for the Sales Analysis cube is
as shown in the following image.
The Customer dimension contains a single multi-level hierarchy named Geography. The
structure of the Geography hierarchy is shown in the following image.
The Sales Analysis cube’s calculation script defines one calculated measure named Sales Per
Capit
a The calculated measure expression divides the Revenue measure by the Population
measure and multiplies the result by 1,000. This calculation represents revenue per 1,000
people.
The Sales Analysis cube produces correct Sales Per Capita results for each country of the
world; however, the Grand Total for all countries is incorrect, as shown in the following
image (rows 2-239 have been hidden).
A role named Analysts grants Read permission for the Sales Analysis cube to all sales and
marketing analysts in the company.
SQL Server Reporting Services (SSRS) is configured in SharePoint integrated mode. All
reports are based on shared data sources.
Corporate logo images used in reports were originally configured as data-bound images
sourced from a SQL Server relational database table. The image data has been exported to
JPG files. The image files are hosted on the Internet-facing web server. All reports have been
modified to reference the corporate logo images by using the fully qualified URLs of the
image files. A red X currently appears in place of the corporate logo in reports.
Users configure data alerts on certain reports. Users can view a report named Sales
Profitability on demand; however, notification email messages are no longer being sent when
Sales Profitability report data satisfies alert definition rules. The alert schedule settings for the
Sales Profitability report are configured as shown in the following image.
Business Requirements
Data Models
Users must be able to:
• Provide context to measures and filter measures by using all related data warehouse
dimensions.
• Analyze measures by order date or ship date.
Additionally, users must be able to add a measure named Sales to the report canvas by
clicking only once in the Power View field list. The Sales measure must allow users to
analyze the sum of the values in the Revenue column of the FactSales data warehouse table.
Users must be able to change the aggregation function of the Sales measure.
Analysis and Reporting
A sales manager has requested the following query results from the Sales Analysis cube for
the 2012 fiscal year:
• Australian postal codes and sales in descending order of sales.
• Australian states and the ratio of sales achieved by the 10 highest customer sales made
for each city in that state.
Technical Requirements
ETL Processes
If an SSIS package variable value changes, the package must log the variable name and the
new variable value to a custom log table.
The StageFactSales package must load the contents of all files that match the file name
pattern. The source file name must also be stored in a column of the data warehouse staging
table.
In the design of the LoadFactSales package, if a lookup of the dimension surrogate key value
for the product code fails, the row details must be emailed to the data steward and written as
an error message to the SSIS catalog log by using the public API.
You must configure the LoadFactFreightCosts package to remove duplicate rows, by using
the least development effort.
Data Models
Users of the Sales Analysis cube frequently filter on the current month’s data. You must
ensure that queries to the Sales Analysis cube default to the current month in the Order Date
dimension for all users.
You must develop and deploy a tabular project for the exclusive use as a Power View
reporting data source. The model must be based on the data warehouse. Model table names
must exclude the Dim or Fact prefixes. All measures in the model must format values to
display zero decimal places.
Analysis and Reporting
Reports must be developed that combine the SSIS catalog log messages with the package
variable value changes.
###EndCaseStudy###
DRAG DROP
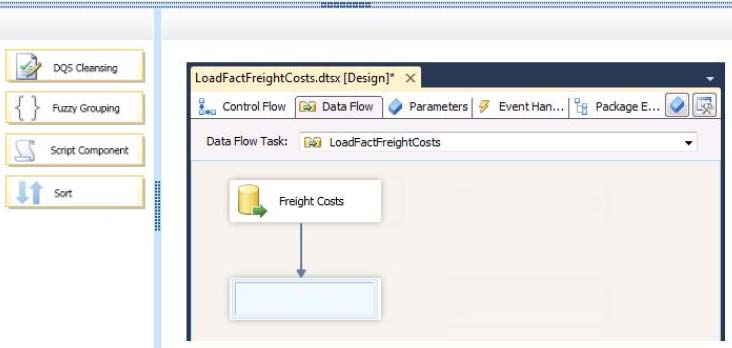
You need to configure the LoadFactFreightCosts package to address the data integrity
issues.
Which data flow component should you use?
To answer, drag the appropriate data flow component to the answer area.
Where should you set the default member Multidimensional Expressions (MDX) expression?
###BeginCaseStudy###
Case Study: 5
Contoso, Ltd Case B
General Background
You are the business intelligence (BI) solutions architect for Contoso, Ltd, an online retailer.
You produce solutions by using SQL Server 2012 Business Intelligence edition and
Microsoft SharePoint Server 2010 Service Pack 1 (SP1) Enterprise edition.
A SharePoint farm has been installed and configured for intranet access only. An Internetfacing web server hosts the company’s public e-commerce website. Anonymous access is not
configured on the Internet-facing web server.
Data Warehouse
The data warehouse is deployed on a 5QL Server 2012 relational database instance. The data
warehouse is structured as shown in the following diagram.
The following Transact-SQL (T-SQL) script is used to create the FactSales and
FactPopulation tables:
The FactPopulation table is loaded each year with data from a Windows Azure Marketplace
commercial dataset. The table contains a snapshot of the population values for all countries of
the world for each year. The world population for the last year loaded exceeds 6.8 billion
people.
ETL Process
SQL Server Integration Services (SSIS) is used to load data into the data warehouse. All SSIS
projects are developed by using the project deployment model.
A package named StageFactSales loads data into a data warehouse staging table. The package
sources its data from numerous CSV files exported from a mainframe system. The CSV file
names begin with the letters GLSD followed by a unique numeric identifier that never
exceeds six digits. The data content of each CSV file is identically formatted.
A package named LoadFactFreightCosts sources data from a Windows Azure SQL Database
database that has data integrity problems. The package may retrieve duplicate rows from the
database.
The package variables of all packages have the RaiseChangedEvent property set to true. A
package-level event handler for the OnVariableValueChanged event consists of an Execute
SQL task that logs the System::VariableName and System::VariableValue variables.
Data Models
SQL Server Analysis Services (SSAS) is used to host the Corporate BI multidimensional
database. The Corporate BI database contains a single data source view named Data
Warehouse. The Data Warehouse data source view consists of all data warehouse tables. All
data source view tables have been converted to named queries.
The Corporate BI database contains a single cube named Sales Analysis and three database
dimensions: Date, Customer and Product. The dimension usage for the Sales Analysis cube is
as shown in the following image.
The Customer dimension contains a single multi-level hierarchy named Geography. The
structure of the Geography hierarchy is shown in the following image.
The Sales Analysis cube’s calculation script defines one calculated measure named Sales Per
Capit
a The calculated measure expression divides the Revenue measure by the Population
measure and multiplies the result by 1,000. This calculation represents revenue per 1,000
people.
The Sales Analysis cube produces correct Sales Per Capita results for each country of the
world; however, the Grand Total for all countries is incorrect, as shown in the following
image (rows 2-239 have been hidden).
A role named Analysts grants Read permission for the Sales Analysis cube to all sales and
marketing analysts in the company.
SQL Server Reporting Services (SSRS) is configured in SharePoint integrated mode. All
reports are based on shared data sources.
Corporate logo images used in reports were originally configured as data-bound images
sourced from a SQL Server relational database table. The image data has been exported to
JPG files. The image files are hosted on the Internet-facing web server. All reports have been
modified to reference the corporate logo images by using the fully qualified URLs of the
image files. A red X currently appears in place of the corporate logo in reports.
Users configure data alerts on certain reports. Users can view a report named Sales
Profitability on demand; however, notification email messages are no longer being sent when
Sales Profitability report data satisfies alert definition rules. The alert schedule settings for the
Sales Profitability report are configured as shown in the following image.
Business Requirements
Data Models
Users must be able to:
• Provide context to measures and filter measures by using all related data warehouse
dimensions.
• Analyze measures by order date or ship date.
Additionally, users must be able to add a measure named Sales to the report canvas by
clicking only once in the Power View field list. The Sales measure must allow users to
analyze the sum of the values in the Revenue column of the FactSales data warehouse table.
Users must be able to change the aggregation function of the Sales measure.
Analysis and Reporting
A sales manager has requested the following query results from the Sales Analysis cube for
the 2012 fiscal year:
• Australian postal codes and sales in descending order of sales.
• Australian states and the ratio of sales achieved by the 10 highest customer sales made
for each city in that state.
Technical Requirements
ETL Processes
If an SSIS package variable value changes, the package must log the variable name and the
new variable value to a custom log table.
The StageFactSales package must load the contents of all files that match the file name
pattern. The source file name must also be stored in a column of the data warehouse staging
table.
In the design of the LoadFactSales package, if a lookup of the dimension surrogate key value
for the product code fails, the row details must be emailed to the data steward and written as
an error message to the SSIS catalog log by using the public API.
You must configure the LoadFactFreightCosts package to remove duplicate rows, by using
the least development effort.
Data Models
Users of the Sales Analysis cube frequently filter on the current month’s data. You must
ensure that queries to the Sales Analysis cube default to the current month in the Order Date
dimension for all users.
You must develop and deploy a tabular project for the exclusive use as a Power View
reporting data source. The model must be based on the data warehouse. Model table names
must exclude the Dim or Fact prefixes. All measures in the model must format values to
display zero decimal places.
Analysis and Reporting
Reports must be developed that combine the SSIS catalog log messages with the package
variable value changes.
###EndCaseStudy###
You need to ensure that queries to the Sales Analysis cube default to the correct time
period.
Where should you set the default member Multidimensional Expressions (MDX) expression?
You need to ensure that the Sales measure in the Power View field list meets the requirements
###BeginCaseStudy###
Case Study: 5
Contoso, Ltd Case B
General Background
You are the business intelligence (BI) solutions architect for Contoso, Ltd, an online retailer.
You produce solutions by using SQL Server 2012 Business Intelligence edition and
Microsoft SharePoint Server 2010 Service Pack 1 (SP1) Enterprise edition.
A SharePoint farm has been installed and configured for intranet access only. An Internetfacing web server hosts the company’s public e-commerce website. Anonymous access is not
configured on the Internet-facing web server.
Data Warehouse
The data warehouse is deployed on a 5QL Server 2012 relational database instance. The data
warehouse is structured as shown in the following diagram.
The following Transact-SQL (T-SQL) script is used to create the FactSales and
FactPopulation tables:
The FactPopulation table is loaded each year with data from a Windows Azure Marketplace
commercial dataset. The table contains a snapshot of the population values for all countries of
the world for each year. The world population for the last year loaded exceeds 6.8 billion
people.
ETL Process
SQL Server Integration Services (SSIS) is used to load data into the data warehouse. All SSIS
projects are developed by using the project deployment model.
A package named StageFactSales loads data into a data warehouse staging table. The package
sources its data from numerous CSV files exported from a mainframe system. The CSV file
names begin with the letters GLSD followed by a unique numeric identifier that never
exceeds six digits. The data content of each CSV file is identically formatted.
A package named LoadFactFreightCosts sources data from a Windows Azure SQL Database
database that has data integrity problems. The package may retrieve duplicate rows from the
database.
The package variables of all packages have the RaiseChangedEvent property set to true. A
package-level event handler for the OnVariableValueChanged event consists of an Execute
SQL task that logs the System::VariableName and System::VariableValue variables.
Data Models
SQL Server Analysis Services (SSAS) is used to host the Corporate BI multidimensional
database. The Corporate BI database contains a single data source view named Data
Warehouse. The Data Warehouse data source view consists of all data warehouse tables. All
data source view tables have been converted to named queries.
The Corporate BI database contains a single cube named Sales Analysis and three database
dimensions: Date, Customer and Product. The dimension usage for the Sales Analysis cube is
as shown in the following image.
The Customer dimension contains a single multi-level hierarchy named Geography. The
structure of the Geography hierarchy is shown in the following image.
The Sales Analysis cube’s calculation script defines one calculated measure named Sales Per
Capit
a The calculated measure expression divides the Revenue measure by the Population
measure and multiplies the result by 1,000. This calculation represents revenue per 1,000
people.
The Sales Analysis cube produces correct Sales Per Capita results for each country of the
world; however, the Grand Total for all countries is incorrect, as shown in the following
image (rows 2-239 have been hidden).
A role named Analysts grants Read permission for the Sales Analysis cube to all sales and
marketing analysts in the company.
SQL Server Reporting Services (SSRS) is configured in SharePoint integrated mode. All
reports are based on shared data sources.
Corporate logo images used in reports were originally configured as data-bound images
sourced from a SQL Server relational database table. The image data has been exported to
JPG files. The image files are hosted on the Internet-facing web server. All reports have been
modified to reference the corporate logo images by using the fully qualified URLs of the
image files. A red X currently appears in place of the corporate logo in reports.
Users configure data alerts on certain reports. Users can view a report named Sales
Profitability on demand; however, notification email messages are no longer being sent when
Sales Profitability report data satisfies alert definition rules. The alert schedule settings for the
Sales Profitability report are configured as shown in the following image.
Business Requirements
Data Models
Users must be able to:
• Provide context to measures and filter measures by using all related data warehouse
dimensions.
• Analyze measures by order date or ship date.
Additionally, users must be able to add a measure named Sales to the report canvas by
clicking only once in the Power View field list. The Sales measure must allow users to
analyze the sum of the values in the Revenue column of the FactSales data warehouse table.
Users must be able to change the aggregation function of the Sales measure.
Analysis and Reporting
A sales manager has requested the following query results from the Sales Analysis cube for
the 2012 fiscal year:
• Australian postal codes and sales in descending order of sales.
• Australian states and the ratio of sales achieved by the 10 highest customer sales made
for each city in that state.
Technical Requirements
ETL Processes
If an SSIS package variable value changes, the package must log the variable name and the
new variable value to a custom log table.
The StageFactSales package must load the contents of all files that match the file name
pattern. The source file name must also be stored in a column of the data warehouse staging
table.
In the design of the LoadFactSales package, if a lookup of the dimension surrogate key value
for the product code fails, the row details must be emailed to the data steward and written as
an error message to the SSIS catalog log by using the public API.
You must configure the LoadFactFreightCosts package to remove duplicate rows, by using
the least development effort.
Data Models
Users of the Sales Analysis cube frequently filter on the current month’s data. You must
ensure that queries to the Sales Analysis cube default to the current month in the Order Date
dimension for all users.
You must develop and deploy a tabular project for the exclusive use as a Power View
reporting data source. The model must be based on the data warehouse. Model table names
must exclude the Dim or Fact prefixes. All measures in the model must format values to
display zero decimal places.
Analysis and Reporting
Reports must be developed that combine the SSIS catalog log messages with the package
variable value changes.
###EndCaseStudy###
You need to ensure that the Sales measure in the Power View field list meets the
requirements.
What should you do? (Each correct answer presents a part of the solution. Choose all that
apply.)
Which of the following reasons are possible?
###BeginCaseStudy###
Case Study: 5
Contoso, Ltd Case B
General Background
You are the business intelligence (BI) solutions architect for Contoso, Ltd, an online retailer.
You produce solutions by using SQL Server 2012 Business Intelligence edition and
Microsoft SharePoint Server 2010 Service Pack 1 (SP1) Enterprise edition.
A SharePoint farm has been installed and configured for intranet access only. An Internetfacing web server hosts the company’s public e-commerce website. Anonymous access is not
configured on the Internet-facing web server.
Data Warehouse
The data warehouse is deployed on a 5QL Server 2012 relational database instance. The data
warehouse is structured as shown in the following diagram.
The following Transact-SQL (T-SQL) script is used to create the FactSales and
FactPopulation tables:
The FactPopulation table is loaded each year with data from a Windows Azure Marketplace
commercial dataset. The table contains a snapshot of the population values for all countries of
the world for each year. The world population for the last year loaded exceeds 6.8 billion
people.
ETL Process
SQL Server Integration Services (SSIS) is used to load data into the data warehouse. All SSIS
projects are developed by using the project deployment model.
A package named StageFactSales loads data into a data warehouse staging table. The package
sources its data from numerous CSV files exported from a mainframe system. The CSV file
names begin with the letters GLSD followed by a unique numeric identifier that never
exceeds six digits. The data content of each CSV file is identically formatted.
A package named LoadFactFreightCosts sources data from a Windows Azure SQL Database
database that has data integrity problems. The package may retrieve duplicate rows from the
database.
The package variables of all packages have the RaiseChangedEvent property set to true. A
package-level event handler for the OnVariableValueChanged event consists of an Execute
SQL task that logs the System::VariableName and System::VariableValue variables.
Data Models
SQL Server Analysis Services (SSAS) is used to host the Corporate BI multidimensional
database. The Corporate BI database contains a single data source view named Data
Warehouse. The Data Warehouse data source view consists of all data warehouse tables. All
data source view tables have been converted to named queries.
The Corporate BI database contains a single cube named Sales Analysis and three database
dimensions: Date, Customer and Product. The dimension usage for the Sales Analysis cube is
as shown in the following image.
The Customer dimension contains a single multi-level hierarchy named Geography. The
structure of the Geography hierarchy is shown in the following image.
The Sales Analysis cube’s calculation script defines one calculated measure named Sales Per
Capit
a The calculated measure expression divides the Revenue measure by the Population
measure and multiplies the result by 1,000. This calculation represents revenue per 1,000
people.
The Sales Analysis cube produces correct Sales Per Capita results for each country of the
world; however, the Grand Total for all countries is incorrect, as shown in the following
image (rows 2-239 have been hidden).
A role named Analysts grants Read permission for the Sales Analysis cube to all sales and
marketing analysts in the company.
SQL Server Reporting Services (SSRS) is configured in SharePoint integrated mode. All
reports are based on shared data sources.
Corporate logo images used in reports were originally configured as data-bound images
sourced from a SQL Server relational database table. The image data has been exported to
JPG files. The image files are hosted on the Internet-facing web server. All reports have been
modified to reference the corporate logo images by using the fully qualified URLs of the
image files. A red X currently appears in place of the corporate logo in reports.
Users configure data alerts on certain reports. Users can view a report named Sales
Profitability on demand; however, notification email messages are no longer being sent when
Sales Profitability report data satisfies alert definition rules. The alert schedule settings for the
Sales Profitability report are configured as shown in the following image.
Business Requirements
Data Models
Users must be able to:
• Provide context to measures and filter measures by using all related data warehouse
dimensions.
• Analyze measures by order date or ship date.
Additionally, users must be able to add a measure named Sales to the report canvas by
clicking only once in the Power View field list. The Sales measure must allow users to
analyze the sum of the values in the Revenue column of the FactSales data warehouse table.
Users must be able to change the aggregation function of the Sales measure.
Analysis and Reporting
A sales manager has requested the following query results from the Sales Analysis cube for
the 2012 fiscal year:
• Australian postal codes and sales in descending order of sales.
• Australian states and the ratio of sales achieved by the 10 highest customer sales made
for each city in that state.
Technical Requirements
ETL Processes
If an SSIS package variable value changes, the package must log the variable name and the
new variable value to a custom log table.
The StageFactSales package must load the contents of all files that match the file name
pattern. The source file name must also be stored in a column of the data warehouse staging
table.
In the design of the LoadFactSales package, if a lookup of the dimension surrogate key value
for the product code fails, the row details must be emailed to the data steward and written as
an error message to the SSIS catalog log by using the public API.
You must configure the LoadFactFreightCosts package to remove duplicate rows, by using
the least development effort.
Data Models
Users of the Sales Analysis cube frequently filter on the current month’s data. You must
ensure that queries to the Sales Analysis cube default to the current month in the Order Date
dimension for all users.
You must develop and deploy a tabular project for the exclusive use as a Power View
reporting data source. The model must be based on the data warehouse. Model table names
must exclude the Dim or Fact prefixes. All measures in the model must format values to
display zero decimal places.
Analysis and Reporting
Reports must be developed that combine the SSIS catalog log messages with the package
variable value changes.
###EndCaseStudy###
You need to identify the reasons that data alert notifications are not being sent.
Which of the following reasons are possible? (Each correct answer presents a complete
solution. Choose al that apply.)