

Which code block should you use?
###BeginCaseStudy###
Case Study: 2
Scenario 2
Application Information
You have two servers named SQL1 and SQL2 that have SQL Server 2012 installed.
You have an application that is used to schedule and manage conferences.
Users report that the application has many errors and is very slow.
You are updating the application to resolve the issues.
You plan to create a new database on SQL1 to support the application. A junior database
administrator has created all the scripts that will be used to create the database. The script that
you plan to use to create the tables for the new database is shown in Tables.sql. The script
that you plan to use to create the stored procedures for the new database is shown in
StoredProcedures.sql. The script that you plan to use to create the indexes for the new
database is shown in Indexes.sql. (Line numbers are included for reference only.)
A database named DB2 resides on SQL2. DB2 has a table named SpeakerAudit that will
audit changes to a table named Speakers.
A stored procedure named usp_UpdateSpeakersName will be executed only by other stored
procedures. The stored procedures executing usp_UpdateSpeakersName will always handle
transactions.
A stored procedure named usp_SelectSpeakersByName will be used to retrieve the names of
speakers. Usp_SelectSpeakersByName can read uncommitted data.
A stored procedure named usp_GetFutureSessions will be used to retrieve sessions that will
occur in the future.
Procedures.sql

Indexes.sql
Tables.sql
###EndCaseStudy###
You need to add a new column named Confirmed to the Attendees table.
The solution must meet the following requirements:
Have a default value of false.
Minimize the amount of disk space used.
Which code block should you use?
Which KPI trend MDX expression should you use?
###BeginCaseStudy###
Case Study: 1
Tailspin Toys Case A
Background
You are the business intelligence (BI) solutions architect for Tailspin Toys.
You produce solutions by using SQL Server 2012 Business Intelligence edition and
Microsoft SharePoint Server 2010 Service Pack 1 (SP1) Enterprise edition.
Technical Background
Data Warehouse
The data warehouse is deployed on a SQL Server 2012 relational database. A subset of the
data warehouse schema is shown in the exhibit. (Click the Exhibit button.)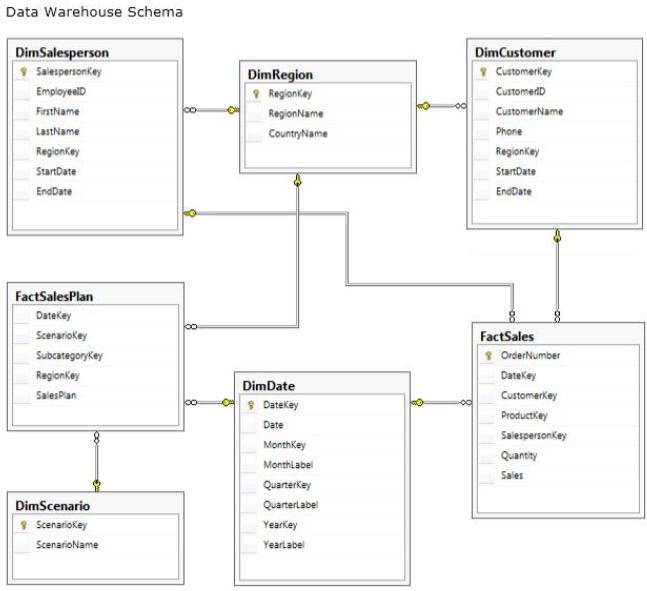
The schema shown does not include the table design for the product dimension.
The schema includes the following tables:
• FactSalesPlan table stores data at month-level granularity. There are
two scenarios: Forecast and Budget.
• The DimDate table stores a record for each date from the beginning of
the company’s operations through to the end of the next year.
• The DimRegion table stores a record for each sales region, classified
by country. Sales regions do not relocate to different countries.
• The DimCustomer table stores a record for each customer.
• The DimSalesperson table stores a record for each salesperson. If a
salesperson relocates to a different region, a new salesperson record is created
to support historically accurate reporting. A new salesperson record is not
created if a salesperson’s name changes.
• The DimScenario table stores one record for each of the two planning
scenarios.
All relationships between tables are enforced by foreign keys. The schema design is as
denormalized as possible for simplicity and accessibility. One exception to this is the
DimRegion table, which is referenced by two dimension tables.
Each product is classified by a category and subcategory and is uniquely identified in the
source database by using its stock-keeping unit (SKU). A new SKU is assigned to a product
if its size changes. Products are never assigned to a different subcategory, and subcategories
are never assigned to a different category.
Extract, transform, load (ETL) processes populate the data warehouse every 24 hours.
ETL Processes
One SQL Server Integration Services (SSIS) package is designed and developed to populate
each data warehouse table. The primary source of data is extracted from a SQL Azure
database. Secondary data sources include a Microsoft Dynamics CRM 2011 on-premises
database.
ETL developers develop packages by using the SSIS project deployment model. The ETL
developers are responsible for testing the packages and producing a deployment file. The
deployment file is given to the ETL administrators. The ETL administrators belong to a
Windows security group named SSISOwners that maps to a SQL Server login named
SSISOwners.
Data Models
The IT department has developed and manages two SQL Server Analysis Services (SSAS) BI
Semantic Model (BISM) projects: Sales Reporting and Sales Analysis. The Sales Reporting
database has been developed as a tabular project. The Sales Analysis database has been
developed as a multidimensional project. Business analysts use PowerPivot for Microsoft
Excel to produce self-managed data models based directly on the data warehouse or the
corporate data models, and publish the PowerPivot workbooks to a SharePoint site.
The sole purpose of the Sales Reporting database is to support business user reporting and adhoc analysis by using Power View. The database is configured for DirectQuery mode and all
model queries result in SSAS querying the data warehouse. The database is based on the
entire data warehouse.
The Sales Analysis database consists of a single SSAS cube named Sales. The Sales cube has
been developed to support sales monitoring, analysts, and planning. The Sales cube metadata
is shown in the following graphic.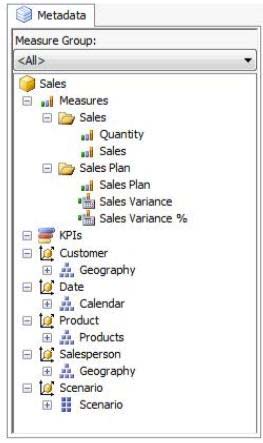
Details of specific Sales cube dimensions are described in the following table.
The Sales cube dimension usage is shown in the following graphic.
The Sales measure group is based on the FactSales table. The Sales Plan measure group is
based on the FactSalesPlan table. The Sales Plan measure group has been configured with a
multidimensional OLAP (MOLAP) writeback partition. Both measure groups use MOLAP
partitions, and aggregation designs are assigned to all partitions. Because the volumes of data
in the data warehouse are large, an incremental processing strategy has been implemented.
The Sales Variance calculated member is computed by subtracting the Sales Plan forecast
amount from Sales. The Sales Variance °/o calculated member is computed by dividing Sales
Variance by Sales. The cube’s Multidimensional Expressions (MDX) script does not set any
color properties.
Analysis and Reporting
SQL Server Reporting Services (SSRS) has been configured in SharePoint integrated mode.
A business analyst has created a PowerPivot workbook named Manufacturing Performance
that integrates data from the data warehouse and manufacturing data from an operational
database hosted in SQL Azure. The workbook has been published in a PowerPivot Gallery
library in SharePoint Server and does not contain any reports. The analyst has scheduled
daily data refresh from the SQL Azure database. Several SSRS reports are based on the
PowerPivot workbook, and all reports are configured with a report execution mode to run on
demand.
Recently users have noticed that data in the PowerPivot workbooks published to SharePoint
Server is not being refreshed. The SharePoint administrator has identified that the Secure
Store Service target application used by the PowerPivot unattended data refresh account has
been deleted.
Business Requirements
ETL Processes
All ETL administrators must have full privileges to administer and monitor the SSIS catalog,
and to import and manage projects.
Data Models
The budget and forecast values must never be accumulated when querying the Sales cube.
Queries should return the forecast sales values by default.
Business users have requested that a single field named SalespersonName be made available
to report the full name of the salesperson in the Sales Reporting data model.
Writeback is used to initialize the budget sales values for a future year and is based on a
weighted allocation of the sales achieved in the previous year.
Analysis and Reporting
Reports based on the Manufacturing Performance PowerPivot workbook must deliver data
that is no more than one hour old.
Management has requested a new report named Regional Sales. This report must be based on
the Sales cube and must allow users to filter by a specific year and present a grid with every
region on the columns and the Products hierarchy on the rows. The hierarchy must initially be
collapsed and allow the user to drill down through the hierarchy to analyze sales.
Additionally, sales values that are less than S5000 must be highlighted in red.
Technical Requirements
Data Warehouse
Business logic in the form of calculations should be defined in the data warehouse to ensure
consistency and availability to all data modeling experiences.
The schema design should remain as denormalized as possible and should not include
unnecessary columns.
The schema design must be extended to include the product dimension data.
ETL Processes
Package executions must log only data flow component phases and errors.
Data Models
Processing time for all data models must be minimized.
A key performance indicator (KPI) must be added to the Sales cube to monitor sales
performance. The KPI trend must use the Standard Arrow indicator to display improving,
static, or deteriorating Sales Variance % values compared to the previous time period.
Analysis and Reporting
IT developers must create a library of SSRS reports based on the Sales Reporting database. A
shared SSRS data source named Sales Reporting must be created in a SharePoint data
connections library.
###EndCaseStudy###
You need to define the trend calculation for the sales performance KPI.
Which KPI trend MDX expression should you use?
Which configuration should you use?
DRAG DROP
###BeginCaseStudy###
Case Study: 1
Tailspin Toys Case A
Background
You are the business intelligence (BI) solutions architect for Tailspin Toys.
You produce solutions by using SQL Server 2012 Business Intelligence edition and
Microsoft SharePoint Server 2010 Service Pack 1 (SP1) Enterprise edition.
Technical Background
Data Warehouse
The data warehouse is deployed on a SQL Server 2012 relational database. A subset of the
data warehouse schema is shown in the exhibit. (Click the Exhibit button.)
The schema shown does not include the table design for the product dimension.
The schema includes the following tables:
• FactSalesPlan table stores data at month-level granularity. There are
two scenarios: Forecast and Budget.
• The DimDate table stores a record for each date from the beginning of
the company’s operations through to the end of the next year.
• The DimRegion table stores a record for each sales region, classified
by country. Sales regions do not relocate to different countries.
• The DimCustomer table stores a record for each customer.
• The DimSalesperson table stores a record for each salesperson. If a
salesperson relocates to a different region, a new salesperson record is created
to support historically accurate reporting. A new salesperson record is not
created if a salesperson’s name changes.
• The DimScenario table stores one record for each of the two planning
scenarios.
All relationships between tables are enforced by foreign keys. The schema design is as
denormalized as possible for simplicity and accessibility. One exception to this is the
DimRegion table, which is referenced by two dimension tables.
Each product is classified by a category and subcategory and is uniquely identified in the
source database by using its stock-keeping unit (SKU). A new SKU is assigned to a product
if its size changes. Products are never assigned to a different subcategory, and subcategories
are never assigned to a different category.
Extract, transform, load (ETL) processes populate the data warehouse every 24 hours.
ETL Processes
One SQL Server Integration Services (SSIS) package is designed and developed to populate
each data warehouse table. The primary source of data is extracted from a SQL Azure
database. Secondary data sources include a Microsoft Dynamics CRM 2011 on-premises
database.
ETL developers develop packages by using the SSIS project deployment model. The ETL
developers are responsible for testing the packages and producing a deployment file. The
deployment file is given to the ETL administrators. The ETL administrators belong to a
Windows security group named SSISOwners that maps to a SQL Server login named
SSISOwners.
Data Models
The IT department has developed and manages two SQL Server Analysis Services (SSAS) BI
Semantic Model (BISM) projects: Sales Reporting and Sales Analysis. The Sales Reporting
database has been developed as a tabular project. The Sales Analysis database has been
developed as a multidimensional project. Business analysts use PowerPivot for Microsoft
Excel to produce self-managed data models based directly on the data warehouse or the
corporate data models, and publish the PowerPivot workbooks to a SharePoint site.
The sole purpose of the Sales Reporting database is to support business user reporting and adhoc analysis by using Power View. The database is configured for DirectQuery mode and all
model queries result in SSAS querying the data warehouse. The database is based on the
entire data warehouse.
The Sales Analysis database consists of a single SSAS cube named Sales. The Sales cube has
been developed to support sales monitoring, analysts, and planning. The Sales cube metadata
is shown in the following graphic.
Details of specific Sales cube dimensions are described in the following table.
The Sales cube dimension usage is shown in the following graphic.
The Sales measure group is based on the FactSales table. The Sales Plan measure group is
based on the FactSalesPlan table. The Sales Plan measure group has been configured with a
multidimensional OLAP (MOLAP) writeback partition. Both measure groups use MOLAP
partitions, and aggregation designs are assigned to all partitions. Because the volumes of data
in the data warehouse are large, an incremental processing strategy has been implemented.
The Sales Variance calculated member is computed by subtracting the Sales Plan forecast
amount from Sales. The Sales Variance °/o calculated member is computed by dividing Sales
Variance by Sales. The cube’s Multidimensional Expressions (MDX) script does not set any
color properties.
Analysis and Reporting
SQL Server Reporting Services (SSRS) has been configured in SharePoint integrated mode.
A business analyst has created a PowerPivot workbook named Manufacturing Performance
that integrates data from the data warehouse and manufacturing data from an operational
database hosted in SQL Azure. The workbook has been published in a PowerPivot Gallery
library in SharePoint Server and does not contain any reports. The analyst has scheduled
daily data refresh from the SQL Azure database. Several SSRS reports are based on the
PowerPivot workbook, and all reports are configured with a report execution mode to run on
demand.
Recently users have noticed that data in the PowerPivot workbooks published to SharePoint
Server is not being refreshed. The SharePoint administrator has identified that the Secure
Store Service target application used by the PowerPivot unattended data refresh account has
been deleted.
Business Requirements
ETL Processes
All ETL administrators must have full privileges to administer and monitor the SSIS catalog,
and to import and manage projects.
Data Models
The budget and forecast values must never be accumulated when querying the Sales cube.
Queries should return the forecast sales values by default.
Business users have requested that a single field named SalespersonName be made available
to report the full name of the salesperson in the Sales Reporting data model.
Writeback is used to initialize the budget sales values for a future year and is based on a
weighted allocation of the sales achieved in the previous year.
Analysis and Reporting
Reports based on the Manufacturing Performance PowerPivot workbook must deliver data
that is no more than one hour old.
Management has requested a new report named Regional Sales. This report must be based on
the Sales cube and must allow users to filter by a specific year and present a grid with every
region on the columns and the Products hierarchy on the rows. The hierarchy must initially be
collapsed and allow the user to drill down through the hierarchy to analyze sales.
Additionally, sales values that are less than S5000 must be highlighted in red.
Technical Requirements
Data Warehouse
Business logic in the form of calculations should be defined in the data warehouse to ensure
consistency and availability to all data modeling experiences.
The schema design should remain as denormalized as possible and should not include
unnecessary columns.
The schema design must be extended to include the product dimension data.
ETL Processes
Package executions must log only data flow component phases and errors.
Data Models
Processing time for all data models must be minimized.
A key performance indicator (KPI) must be added to the Sales cube to monitor sales
performance. The KPI trend must use the Standard Arrow indicator to display improving,
static, or deteriorating Sales Variance % values compared to the previous time period.
Analysis and Reporting
IT developers must create a library of SSRS reports based on the Sales Reporting database. A
shared SSRS data source named Sales Reporting must be created in a SharePoint data
connections library.
###EndCaseStudy###
You need to configure the attribute relationship types for the Salesperson dimension.
Which configuration should you use?
To answer, drag the appropriate pair of attributes and attribute relationships from the list to
the correct location or locations in the answer area. (Answer choices may be used once,
more than once, or not all.)
You need to ascertain the IP addresses of the client computers that are accessing the server
You manage a SQL Server Reporting Services (SSRS) instance. The
ReportingServicesService.exe.config file has been modified to enable logging.
Some users report that they cannot access the server.
You need to ascertain the IP addresses of the client computers that are accessing the
server.
What should you do?
Which statement should you use?
###BeginCaseStudy###
Case Study: 2
Scenario 2
Application Information
You have two servers named SQL1 and SQL2 that have SQL Server 2012 installed.
You have an application that is used to schedule and manage conferences.
Users report that the application has many errors and is very slow.
You are updating the application to resolve the issues.
You plan to create a new database on SQL1 to support the application. A junior database
administrator has created all the scripts that will be used to create the database. The script that
you plan to use to create the tables for the new database is shown in Tables.sql. The script
that you plan to use to create the stored procedures for the new database is shown in
StoredProcedures.sql. The script that you plan to use to create the indexes for the new
database is shown in Indexes.sql. (Line numbers are included for reference only.)
A database named DB2 resides on SQL2. DB2 has a table named SpeakerAudit that will
audit changes to a table named Speakers.
A stored procedure named usp_UpdateSpeakersName will be executed only by other stored
procedures. The stored procedures executing usp_UpdateSpeakersName will always handle
transactions.
A stored procedure named usp_SelectSpeakersByName will be used to retrieve the names of
speakers. Usp_SelectSpeakersByName can read uncommitted data.
A stored procedure named usp_GetFutureSessions will be used to retrieve sessions that will
occur in the future.
Procedures.sql
Indexes.sql
Tables.sql
###EndCaseStudy###
You need to create the object used by the parameter of usp_InsertSessions.
Which statement should you use?
You need to configure package execution logging to meet the requirements
###BeginCaseStudy###
Case Study: 1
Tailspin Toys Case A
Background
You are the business intelligence (BI) solutions architect for Tailspin Toys.
You produce solutions by using SQL Server 2012 Business Intelligence edition and
Microsoft SharePoint Server 2010 Service Pack 1 (SP1) Enterprise edition.
Technical Background
Data Warehouse
The data warehouse is deployed on a SQL Server 2012 relational database. A subset of the
data warehouse schema is shown in the exhibit. (Click the Exhibit button.)
The schema shown does not include the table design for the product dimension.
The schema includes the following tables:
• FactSalesPlan table stores data at month-level granularity. There are
two scenarios: Forecast and Budget.
• The DimDate table stores a record for each date from the beginning of
the company’s operations through to the end of the next year.
• The DimRegion table stores a record for each sales region, classified
by country. Sales regions do not relocate to different countries.
• The DimCustomer table stores a record for each customer.
• The DimSalesperson table stores a record for each salesperson. If a
salesperson relocates to a different region, a new salesperson record is created
to support historically accurate reporting. A new salesperson record is not
created if a salesperson’s name changes.
• The DimScenario table stores one record for each of the two planning
scenarios.
All relationships between tables are enforced by foreign keys. The schema design is as
denormalized as possible for simplicity and accessibility. One exception to this is the
DimRegion table, which is referenced by two dimension tables.
Each product is classified by a category and subcategory and is uniquely identified in the
source database by using its stock-keeping unit (SKU). A new SKU is assigned to a product
if its size changes. Products are never assigned to a different subcategory, and subcategories
are never assigned to a different category.
Extract, transform, load (ETL) processes populate the data warehouse every 24 hours.
ETL Processes
One SQL Server Integration Services (SSIS) package is designed and developed to populate
each data warehouse table. The primary source of data is extracted from a SQL Azure
database. Secondary data sources include a Microsoft Dynamics CRM 2011 on-premises
database.
ETL developers develop packages by using the SSIS project deployment model. The ETL
developers are responsible for testing the packages and producing a deployment file. The
deployment file is given to the ETL administrators. The ETL administrators belong to a
Windows security group named SSISOwners that maps to a SQL Server login named
SSISOwners.
Data Models
The IT department has developed and manages two SQL Server Analysis Services (SSAS) BI
Semantic Model (BISM) projects: Sales Reporting and Sales Analysis. The Sales Reporting
database has been developed as a tabular project. The Sales Analysis database has been
developed as a multidimensional project. Business analysts use PowerPivot for Microsoft
Excel to produce self-managed data models based directly on the data warehouse or the
corporate data models, and publish the PowerPivot workbooks to a SharePoint site.
The sole purpose of the Sales Reporting database is to support business user reporting and adhoc analysis by using Power View. The database is configured for DirectQuery mode and all
model queries result in SSAS querying the data warehouse. The database is based on the
entire data warehouse.
The Sales Analysis database consists of a single SSAS cube named Sales. The Sales cube has
been developed to support sales monitoring, analysts, and planning. The Sales cube metadata
is shown in the following graphic.
Details of specific Sales cube dimensions are described in the following table.
The Sales cube dimension usage is shown in the following graphic.
The Sales measure group is based on the FactSales table. The Sales Plan measure group is
based on the FactSalesPlan table. The Sales Plan measure group has been configured with a
multidimensional OLAP (MOLAP) writeback partition. Both measure groups use MOLAP
partitions, and aggregation designs are assigned to all partitions. Because the volumes of data
in the data warehouse are large, an incremental processing strategy has been implemented.
The Sales Variance calculated member is computed by subtracting the Sales Plan forecast
amount from Sales. The Sales Variance °/o calculated member is computed by dividing Sales
Variance by Sales. The cube’s Multidimensional Expressions (MDX) script does not set any
color properties.
Analysis and Reporting
SQL Server Reporting Services (SSRS) has been configured in SharePoint integrated mode.
A business analyst has created a PowerPivot workbook named Manufacturing Performance
that integrates data from the data warehouse and manufacturing data from an operational
database hosted in SQL Azure. The workbook has been published in a PowerPivot Gallery
library in SharePoint Server and does not contain any reports. The analyst has scheduled
daily data refresh from the SQL Azure database. Several SSRS reports are based on the
PowerPivot workbook, and all reports are configured with a report execution mode to run on
demand.
Recently users have noticed that data in the PowerPivot workbooks published to SharePoint
Server is not being refreshed. The SharePoint administrator has identified that the Secure
Store Service target application used by the PowerPivot unattended data refresh account has
been deleted.
Business Requirements
ETL Processes
All ETL administrators must have full privileges to administer and monitor the SSIS catalog,
and to import and manage projects.
Data Models
The budget and forecast values must never be accumulated when querying the Sales cube.
Queries should return the forecast sales values by default.
Business users have requested that a single field named SalespersonName be made available
to report the full name of the salesperson in the Sales Reporting data model.
Writeback is used to initialize the budget sales values for a future year and is based on a
weighted allocation of the sales achieved in the previous year.
Analysis and Reporting
Reports based on the Manufacturing Performance PowerPivot workbook must deliver data
that is no more than one hour old.
Management has requested a new report named Regional Sales. This report must be based on
the Sales cube and must allow users to filter by a specific year and present a grid with every
region on the columns and the Products hierarchy on the rows. The hierarchy must initially be
collapsed and allow the user to drill down through the hierarchy to analyze sales.
Additionally, sales values that are less than S5000 must be highlighted in red.
Technical Requirements
Data Warehouse
Business logic in the form of calculations should be defined in the data warehouse to ensure
consistency and availability to all data modeling experiences.
The schema design should remain as denormalized as possible and should not include
unnecessary columns.
The schema design must be extended to include the product dimension data.
ETL Processes
Package executions must log only data flow component phases and errors.
Data Models
Processing time for all data models must be minimized.
A key performance indicator (KPI) must be added to the Sales cube to monitor sales
performance. The KPI trend must use the Standard Arrow indicator to display improving,
static, or deteriorating Sales Variance % values compared to the previous time period.
Analysis and Reporting
IT developers must create a library of SSRS reports based on the Sales Reporting database. A
shared SSRS data source named Sales Reporting must be created in a SharePoint data
connections library.
###EndCaseStudy###
You need to configure package execution logging to meet the requirements.
What should you do?
Which design should you use?
DRAG DROP
###BeginCaseStudy###
Case Study: 1
Tailspin Toys Case A
Background
You are the business intelligence (BI) solutions architect for Tailspin Toys.
You produce solutions by using SQL Server 2012 Business Intelligence edition and
Microsoft SharePoint Server 2010 Service Pack 1 (SP1) Enterprise edition.
Technical Background
Data Warehouse
The data warehouse is deployed on a SQL Server 2012 relational database. A subset of the
data warehouse schema is shown in the exhibit. (Click the Exhibit button.)
The schema shown does not include the table design for the product dimension.
The schema includes the following tables:
• FactSalesPlan table stores data at month-level granularity. There are
two scenarios: Forecast and Budget.
• The DimDate table stores a record for each date from the beginning of
the company’s operations through to the end of the next year.
• The DimRegion table stores a record for each sales region, classified
by country. Sales regions do not relocate to different countries.
• The DimCustomer table stores a record for each customer.
• The DimSalesperson table stores a record for each salesperson. If a
salesperson relocates to a different region, a new salesperson record is created
to support historically accurate reporting. A new salesperson record is not
created if a salesperson’s name changes.
• The DimScenario table stores one record for each of the two planning
scenarios.
All relationships between tables are enforced by foreign keys. The schema design is as
denormalized as possible for simplicity and accessibility. One exception to this is the
DimRegion table, which is referenced by two dimension tables.
Each product is classified by a category and subcategory and is uniquely identified in the
source database by using its stock-keeping unit (SKU). A new SKU is assigned to a product
if its size changes. Products are never assigned to a different subcategory, and subcategories
are never assigned to a different category.
Extract, transform, load (ETL) processes populate the data warehouse every 24 hours.
ETL Processes
One SQL Server Integration Services (SSIS) package is designed and developed to populate
each data warehouse table. The primary source of data is extracted from a SQL Azure
database. Secondary data sources include a Microsoft Dynamics CRM 2011 on-premises
database.
ETL developers develop packages by using the SSIS project deployment model. The ETL
developers are responsible for testing the packages and producing a deployment file. The
deployment file is given to the ETL administrators. The ETL administrators belong to a
Windows security group named SSISOwners that maps to a SQL Server login named
SSISOwners.
Data Models
The IT department has developed and manages two SQL Server Analysis Services (SSAS) BI
Semantic Model (BISM) projects: Sales Reporting and Sales Analysis. The Sales Reporting
database has been developed as a tabular project. The Sales Analysis database has been
developed as a multidimensional project. Business analysts use PowerPivot for Microsoft
Excel to produce self-managed data models based directly on the data warehouse or the
corporate data models, and publish the PowerPivot workbooks to a SharePoint site.
The sole purpose of the Sales Reporting database is to support business user reporting and adhoc analysis by using Power View. The database is configured for DirectQuery mode and all
model queries result in SSAS querying the data warehouse. The database is based on the
entire data warehouse.
The Sales Analysis database consists of a single SSAS cube named Sales. The Sales cube has
been developed to support sales monitoring, analysts, and planning. The Sales cube metadata
is shown in the following graphic.
Details of specific Sales cube dimensions are described in the following table.
The Sales cube dimension usage is shown in the following graphic.
The Sales measure group is based on the FactSales table. The Sales Plan measure group is
based on the FactSalesPlan table. The Sales Plan measure group has been configured with a
multidimensional OLAP (MOLAP) writeback partition. Both measure groups use MOLAP
partitions, and aggregation designs are assigned to all partitions. Because the volumes of data
in the data warehouse are large, an incremental processing strategy has been implemented.
The Sales Variance calculated member is computed by subtracting the Sales Plan forecast
amount from Sales. The Sales Variance °/o calculated member is computed by dividing Sales
Variance by Sales. The cube’s Multidimensional Expressions (MDX) script does not set any
color properties.
Analysis and Reporting
SQL Server Reporting Services (SSRS) has been configured in SharePoint integrated mode.
A business analyst has created a PowerPivot workbook named Manufacturing Performance
that integrates data from the data warehouse and manufacturing data from an operational
database hosted in SQL Azure. The workbook has been published in a PowerPivot Gallery
library in SharePoint Server and does not contain any reports. The analyst has scheduled
daily data refresh from the SQL Azure database. Several SSRS reports are based on the
PowerPivot workbook, and all reports are configured with a report execution mode to run on
demand.
Recently users have noticed that data in the PowerPivot workbooks published to SharePoint
Server is not being refreshed. The SharePoint administrator has identified that the Secure
Store Service target application used by the PowerPivot unattended data refresh account has
been deleted.
Business Requirements
ETL Processes
All ETL administrators must have full privileges to administer and monitor the SSIS catalog,
and to import and manage projects.
Data Models
The budget and forecast values must never be accumulated when querying the Sales cube.
Queries should return the forecast sales values by default.
Business users have requested that a single field named SalespersonName be made available
to report the full name of the salesperson in the Sales Reporting data model.
Writeback is used to initialize the budget sales values for a future year and is based on a
weighted allocation of the sales achieved in the previous year.
Analysis and Reporting
Reports based on the Manufacturing Performance PowerPivot workbook must deliver data
that is no more than one hour old.
Management has requested a new report named Regional Sales. This report must be based on
the Sales cube and must allow users to filter by a specific year and present a grid with every
region on the columns and the Products hierarchy on the rows. The hierarchy must initially be
collapsed and allow the user to drill down through the hierarchy to analyze sales.
Additionally, sales values that are less than S5000 must be highlighted in red.
Technical Requirements
Data Warehouse
Business logic in the form of calculations should be defined in the data warehouse to ensure
consistency and availability to all data modeling experiences.
The schema design should remain as denormalized as possible and should not include
unnecessary columns.
The schema design must be extended to include the product dimension data.
ETL Processes
Package executions must log only data flow component phases and errors.
Data Models
Processing time for all data models must be minimized.
A key performance indicator (KPI) must be added to the Sales cube to monitor sales
performance. The KPI trend must use the Standard Arrow indicator to display improving,
static, or deteriorating Sales Variance % values compared to the previous time period.
Analysis and Reporting
IT developers must create a library of SSRS reports based on the Sales Reporting database. A
shared SSRS data source named Sales Reporting must be created in a SharePoint data
connections library.
###EndCaseStudy###
You need to extend the schema design to store the product dimension data.
Which design should you use?
To answer, drag the appropriate table or tables to the correct location or locations in the
answer area. (Fill from left to right. Answer choices may be used once, more than once, or not all.)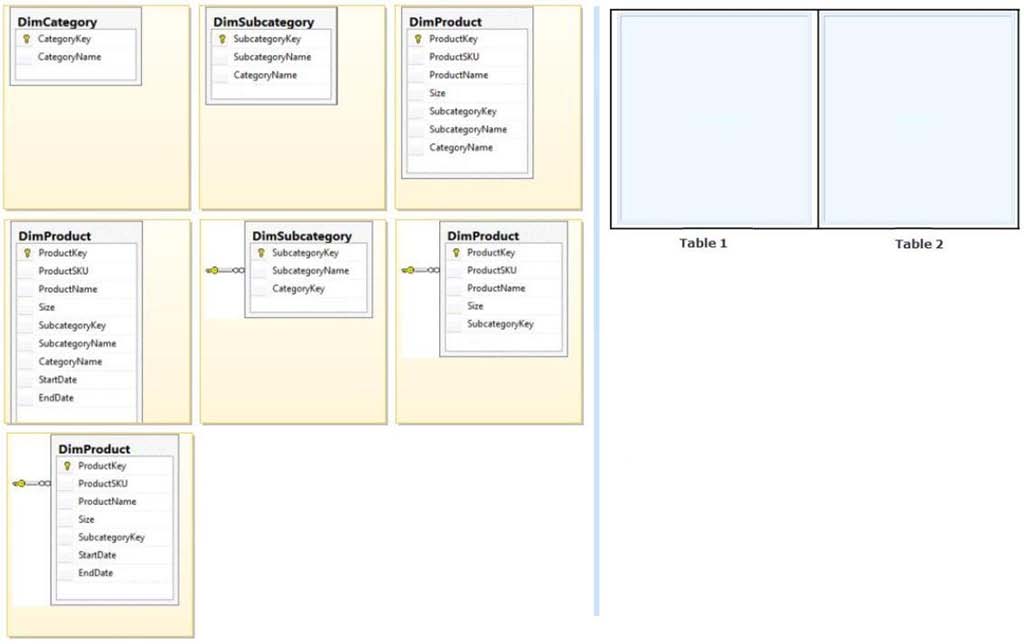
How should you define the expression that is assigned to the connection string property of the data source?
A multinational retailer has retail locations on several continents. A single SQL Server
Reporting Services (SSRS) instance is used for global reporting.
A SQL Server Analysis Services (SSAS) instance for each continent hosts a
multidimensional database named RetailSales. Each RetailSales database stores data only
for the continent in which it resides. All of the SSAS instances are configured identically. The
cube names and objects are identical.
Reports must meet the following requirements:
A report parameter named ServerName must be defined in each report.
When running a report, users must be prompted to select a server instance.
The report data source must use the Microsoft SQL Server Analysis Services data source
type.
You need to create a data source to meet the requirements.
How should you define the expression that is assigned to the connection string property of
the data source?
What should you configure in Procedures.sql?
###BeginCaseStudy###
Case Study: 2
Scenario 2
Application Information
You have two servers named SQL1 and SQL2 that have SQL Server 2012 installed.
You have an application that is used to schedule and manage conferences.
Users report that the application has many errors and is very slow.
You are updating the application to resolve the issues.
You plan to create a new database on SQL1 to support the application. A junior database
administrator has created all the scripts that will be used to create the database. The script that
you plan to use to create the tables for the new database is shown in Tables.sql. The script
that you plan to use to create the stored procedures for the new database is shown in
StoredProcedures.sql. The script that you plan to use to create the indexes for the new
database is shown in Indexes.sql. (Line numbers are included for reference only.)
A database named DB2 resides on SQL2. DB2 has a table named SpeakerAudit that will
audit changes to a table named Speakers.
A stored procedure named usp_UpdateSpeakersName will be executed only by other stored
procedures. The stored procedures executing usp_UpdateSpeakersName will always handle
transactions.
A stored procedure named usp_SelectSpeakersByName will be used to retrieve the names of
speakers. Usp_SelectSpeakersByName can read uncommitted data.
A stored procedure named usp_GetFutureSessions will be used to retrieve sessions that will
occur in the future.
Procedures.sql
Indexes.sql
Tables.sql
###EndCaseStudy###
Developers report that usp_UpdateSessionRoom periodically returns error 3960.
You need to prevent the error from occurring. The solution must ensure that the stored
procedure returns the original values to all of the updated rows.
What should you configure in Procedures.sql?
Which SSRS data connection type should you use?
###BeginCaseStudy###
Case Study: 1
Tailspin Toys Case A
Background
You are the business intelligence (BI) solutions architect for Tailspin Toys.
You produce solutions by using SQL Server 2012 Business Intelligence edition and
Microsoft SharePoint Server 2010 Service Pack 1 (SP1) Enterprise edition.
Technical Background
Data Warehouse
The data warehouse is deployed on a SQL Server 2012 relational database. A subset of the
data warehouse schema is shown in the exhibit. (Click the Exhibit button.)
The schema shown does not include the table design for the product dimension.
The schema includes the following tables:
• FactSalesPlan table stores data at month-level granularity. There are
two scenarios: Forecast and Budget.
• The DimDate table stores a record for each date from the beginning of
the company’s operations through to the end of the next year.
• The DimRegion table stores a record for each sales region, classified
by country. Sales regions do not relocate to different countries.
• The DimCustomer table stores a record for each customer.
• The DimSalesperson table stores a record for each salesperson. If a
salesperson relocates to a different region, a new salesperson record is created
to support historically accurate reporting. A new salesperson record is not
created if a salesperson’s name changes.
• The DimScenario table stores one record for each of the two planning
scenarios.
All relationships between tables are enforced by foreign keys. The schema design is as
denormalized as possible for simplicity and accessibility. One exception to this is the
DimRegion table, which is referenced by two dimension tables.
Each product is classified by a category and subcategory and is uniquely identified in the
source database by using its stock-keeping unit (SKU). A new SKU is assigned to a product
if its size changes. Products are never assigned to a different subcategory, and subcategories
are never assigned to a different category.
Extract, transform, load (ETL) processes populate the data warehouse every 24 hours.
ETL Processes
One SQL Server Integration Services (SSIS) package is designed and developed to populate
each data warehouse table. The primary source of data is extracted from a SQL Azure
database. Secondary data sources include a Microsoft Dynamics CRM 2011 on-premises
database.
ETL developers develop packages by using the SSIS project deployment model. The ETL
developers are responsible for testing the packages and producing a deployment file. The
deployment file is given to the ETL administrators. The ETL administrators belong to a
Windows security group named SSISOwners that maps to a SQL Server login named
SSISOwners.
Data Models
The IT department has developed and manages two SQL Server Analysis Services (SSAS) BI
Semantic Model (BISM) projects: Sales Reporting and Sales Analysis. The Sales Reporting
database has been developed as a tabular project. The Sales Analysis database has been
developed as a multidimensional project. Business analysts use PowerPivot for Microsoft
Excel to produce self-managed data models based directly on the data warehouse or the
corporate data models, and publish the PowerPivot workbooks to a SharePoint site.
The sole purpose of the Sales Reporting database is to support business user reporting and adhoc analysis by using Power View. The database is configured for DirectQuery mode and all
model queries result in SSAS querying the data warehouse. The database is based on the
entire data warehouse.
The Sales Analysis database consists of a single SSAS cube named Sales. The Sales cube has
been developed to support sales monitoring, analysts, and planning. The Sales cube metadata
is shown in the following graphic.
Details of specific Sales cube dimensions are described in the following table.
The Sales cube dimension usage is shown in the following graphic.
The Sales measure group is based on the FactSales table. The Sales Plan measure group is
based on the FactSalesPlan table. The Sales Plan measure group has been configured with a
multidimensional OLAP (MOLAP) writeback partition. Both measure groups use MOLAP
partitions, and aggregation designs are assigned to all partitions. Because the volumes of data
in the data warehouse are large, an incremental processing strategy has been implemented.
The Sales Variance calculated member is computed by subtracting the Sales Plan forecast
amount from Sales. The Sales Variance °/o calculated member is computed by dividing Sales
Variance by Sales. The cube’s Multidimensional Expressions (MDX) script does not set any
color properties.
Analysis and Reporting
SQL Server Reporting Services (SSRS) has been configured in SharePoint integrated mode.
A business analyst has created a PowerPivot workbook named Manufacturing Performance
that integrates data from the data warehouse and manufacturing data from an operational
database hosted in SQL Azure. The workbook has been published in a PowerPivot Gallery
library in SharePoint Server and does not contain any reports. The analyst has scheduled
daily data refresh from the SQL Azure database. Several SSRS reports are based on the
PowerPivot workbook, and all reports are configured with a report execution mode to run on
demand.
Recently users have noticed that data in the PowerPivot workbooks published to SharePoint
Server is not being refreshed. The SharePoint administrator has identified that the Secure
Store Service target application used by the PowerPivot unattended data refresh account has
been deleted.
Business Requirements
ETL Processes
All ETL administrators must have full privileges to administer and monitor the SSIS catalog,
and to import and manage projects.
Data Models
The budget and forecast values must never be accumulated when querying the Sales cube.
Queries should return the forecast sales values by default.
Business users have requested that a single field named SalespersonName be made available
to report the full name of the salesperson in the Sales Reporting data model.
Writeback is used to initialize the budget sales values for a future year and is based on a
weighted allocation of the sales achieved in the previous year.
Analysis and Reporting
Reports based on the Manufacturing Performance PowerPivot workbook must deliver data
that is no more than one hour old.
Management has requested a new report named Regional Sales. This report must be based on
the Sales cube and must allow users to filter by a specific year and present a grid with every
region on the columns and the Products hierarchy on the rows. The hierarchy must initially be
collapsed and allow the user to drill down through the hierarchy to analyze sales.
Additionally, sales values that are less than S5000 must be highlighted in red.
Technical Requirements
Data Warehouse
Business logic in the form of calculations should be defined in the data warehouse to ensure
consistency and availability to all data modeling experiences.
The schema design should remain as denormalized as possible and should not include
unnecessary columns.
The schema design must be extended to include the product dimension data.
ETL Processes
Package executions must log only data flow component phases and errors.
Data Models
Processing time for all data models must be minimized.
A key performance indicator (KPI) must be added to the Sales cube to monitor sales
performance. The KPI trend must use the Standard Arrow indicator to display improving,
static, or deteriorating Sales Variance % values compared to the previous time period.
Analysis and Reporting
IT developers must create a library of SSRS reports based on the Sales Reporting database. A
shared SSRS data source named Sales Reporting must be created in a SharePoint data
connections library.
###EndCaseStudy###
You need to create the Sales Reporting shared SSRS data source.
Which SSRS data connection type should you use?