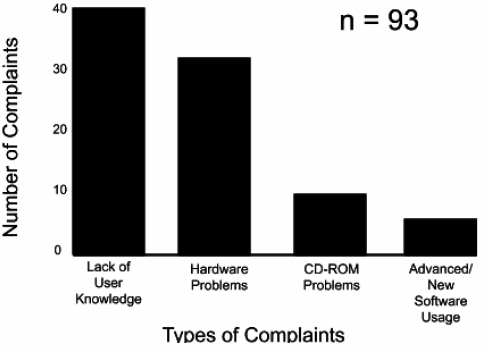
An organization has collected data on the complaints made by personal computer users and has categorized the complaints.
The chart displays the:
A. Arithmetic mean of each computer complaint.
B. Relative frequency of each computer complaint.
C. Median of each computer complaint.
D. Absolute frequency of each computer complaint.
Explanation:
This Pareto diagram depicts the frequencies of complaints in absolute terms. It displays the actual number of each type of complaint. The chart does not display arithmetic means, relative frequencies, or medians of each type of complaint.