

What is a possible reason the coefficient for variable B was negative and not positive?
Refer to the exhibit.
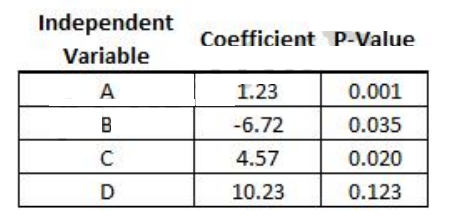
After analyzing a dataset, you report findings to your team:
1. Variables A and C are significantly and positively impacting the dependent variable.
2. Variable B is significantly and negatively impacting the dependent variable.
3. Variable D is not significantly impacting the dependent variable.
After seeing your findings, the majority of your team agreed that variable B should be positively
impacting the dependent variable.
What is a possible reason the coefficient for variable B was negative and not positive?
Which function can you use in your query to distinguish the row from a regular row to a subtotal row?
Refer to the Exhibit.
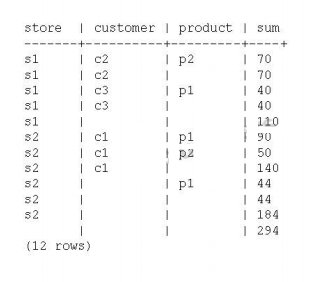
You are working on creating an OLAP query that outputs several rows of with summary rows of subtotals and grand totals in addition to regular rows that may contain NULL as shown in the exhibit. Which function can you use in your query to distinguish the row from a regular row to a subtotal row?
Which column in the end of year report requires the use of a window function?
Refer to the exhibit.

You are assigned to do an end of the year sales analysis of 1, 000 different products, based on the transaction table. Which column in the end of year report requires the use of a window function?
Which decision tree is valid for the data?
Refer to the Exhibit.

In the Exhibit, the table shows the values for the input Boolean attributes “A”, “B”, and “C”. It also shows the values for the output attribute “class”. Which decision tree is valid for the data?
Based on this information, on which attribute would you expect the next split to be in the decision tree?
Refer to the exhibit.

You are building a decision tree. In this exhibit, four variables are listed with their respective values of info-gain.
Based on this information, on which attribute would you expect the next split to be in the decision tree?
What should you do next?
Refer to the exhibit.

You have created a density plot of purchase amounts from a retail website as shown. What should you do next?
Which analytical method could produce the probabilities needed to build this exhibit?
Refer to the exhibit.

In the exhibit, the x-axis represents the derived probability of a borrower defaulting on a loan. Also in the exhibit, the pink represents borrowers that are known to have not defaulted on their loan, and the blue represents borrowers that are known to have defaulted on their loan.
Which analytical method could produce the probabilities needed to build this exhibit?
What can you conclude based only on this exhibit?
Refer to the exhibit.
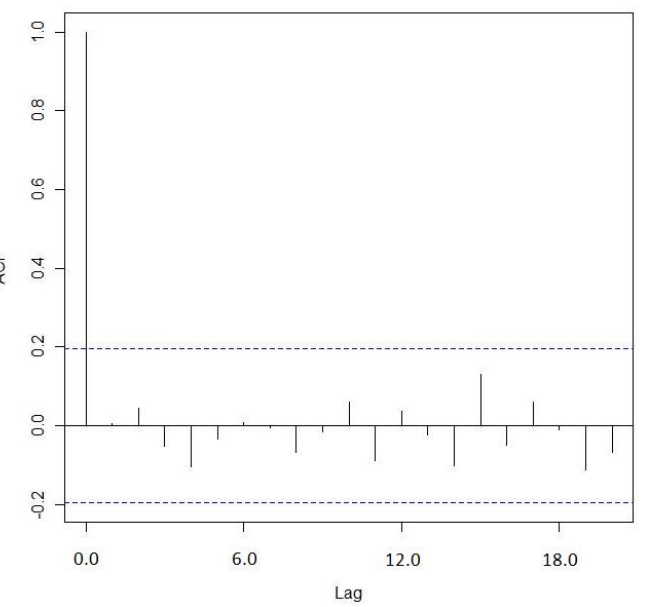
In the exhibit, a correlogram is provided based on an autocorrelation analysis of a sample dataset.
What can you conclude based only on this exhibit?
How would you proceed, based on this distribution?
Refer to the exhibit.

You have plotted the distribution of savings account sizes for your bank. How would you proceed, based on this distribution?
For effective visualization, what is the chart’s primary flaw?
Refer to the Exhibit.

In the Exhibit. For effective visualization, what is the chart’s primary flaw?