

Which figure represents the entropy function relative to a Boolean classification and is represented by the fo
Refer to the exhibit.
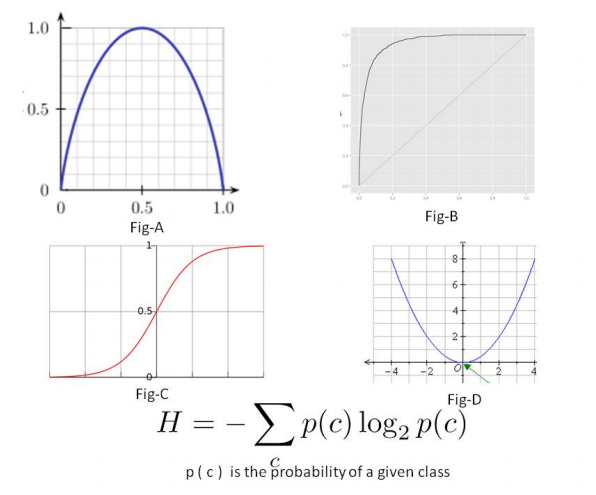
The exhibit shows four graphs labeled as Fig A thorough Fig D. Which figure represents the entropy function relative to a Boolean classification and is represented by the formula shown in Exhibit?
What would be the assigned probability, p(good), of a single male with no known savings?
Refer to the exhibit.
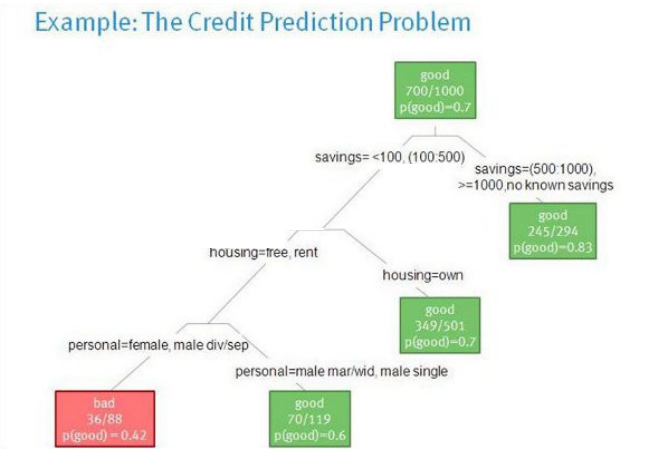
What provides the decision tree for predicting whether or not someone is a good or bad credit risk.
What would be the assigned probability, p(good), of a single male with no known savings?
Which of the four documents is most relevant to the analyst’s search?
Refer to the exhibit.
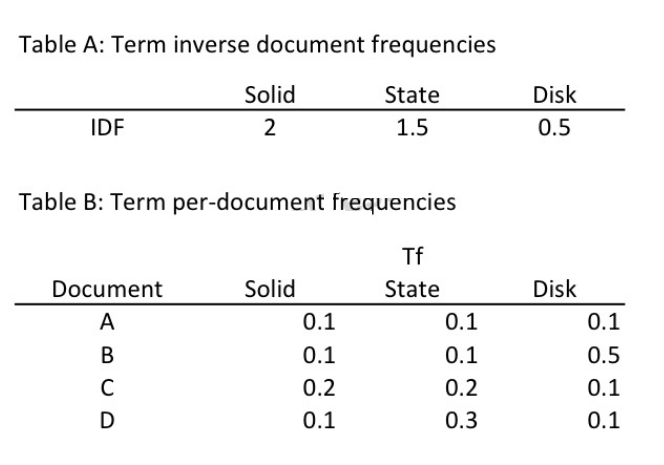
Click on the calculator icon in the upper left corner. An analyst is searching a corpus of documents for the topic “solid state disk”. In the Exhibit, Table A provides the inverse document frequency for each term across the corpus. Table B provides each term’s frequency in four documents selected from corpus. Which of the four documents is most relevant to the analyst’s search?
Which type of data issue would you suspect based on the exhibit?
Refer to the exhibit.
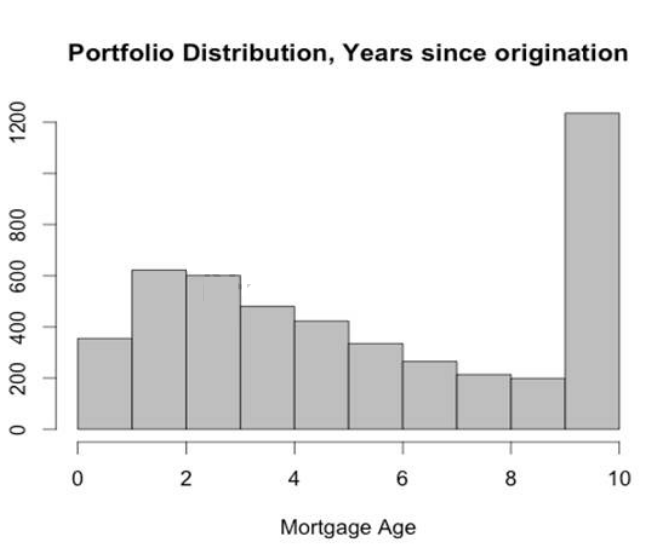
Which type of data issue would you suspect based on the exhibit?
What can you conclude from only this exhibit?
Refer to the exhibit.
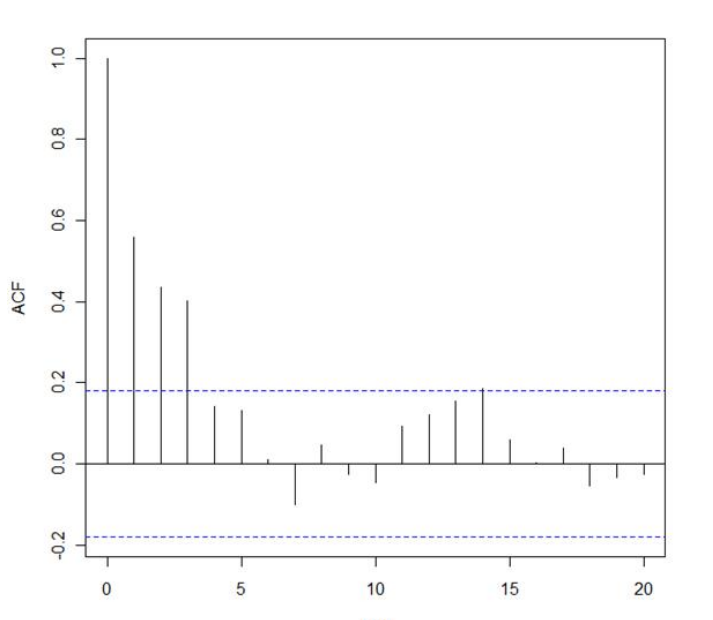
In the exhibit, a correlogram is provided based on an autocorrelation analysis of a sample dataset.
What can you conclude from only this exhibit?
What are the classification (Y = 0 or 1) and the probability of the classification for the tupleX(0, 0, 1) usi
Refer to the exhibit
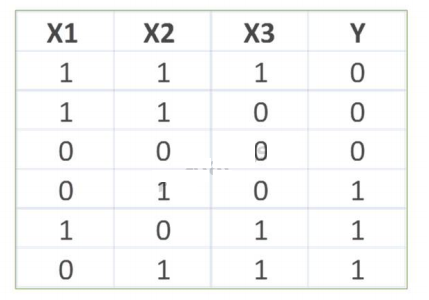
Consider the training data set shown in the exhibit. What are the classification (Y = 0 or 1) and the probability of the classification for the tupleX(0, 0, 1) using Naive Bayesian classifier?
Based on the exhibit, how many clusters should you use in your analysis?
Refer to the exhibit.
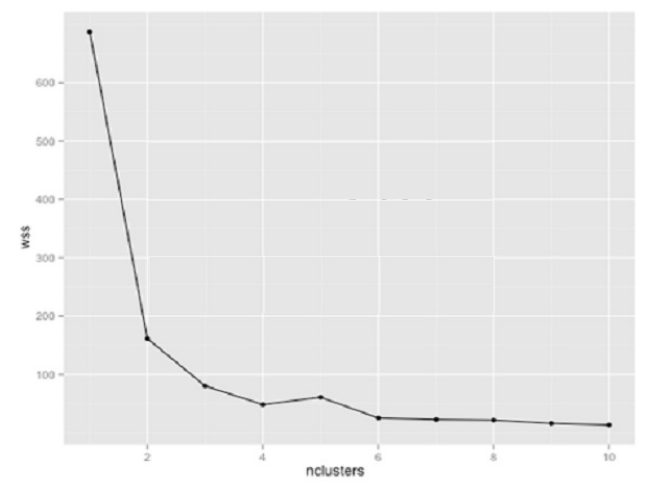
You are using k-means clustering to discover groupings within a data set. You plot within-sum-of-squares (wss) of multiple cluster sizes. Based on the exhibit, how many clusters should you use in your analysis?
Which of the rules will be kept in the analysis?
Refer to the exhibit.
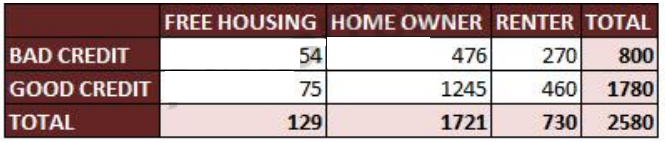
Click on the calculator icon in the upper left corner. You are given a list of pre-defined association rules:
A) RENTER => BAD CREDIT
B) RENTER => GOOD CREDIT
C) HOME OWNER => BAD CREDIT
D) HOME OWNER => GOOD CREDIT
E) FREE HOUSING => BAD CREDIT
F) FREE HOUSING => GOOD CREDIT
For your next analysis, you must limit your dataset based on rules with confidence greater than 60%.
Which of the rules will be kept in the analysis?
How many customer groups should you specify?
Refer to the exhibit.
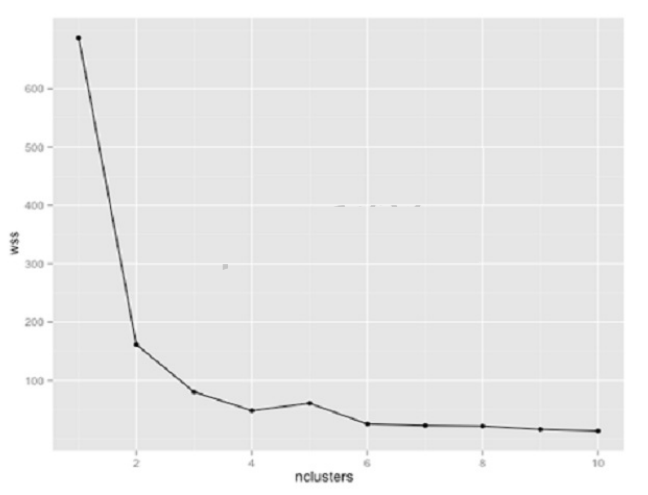
You are using K-means clustering to classify customer behavior for a large retailer. You need to determine the optimum number of customer groups. You plot the within-sum-of-squares (wss) data as shown in the exhibit. How many customer groups should you specify?
What is your assessment of the model?
Refer to the exhibit.
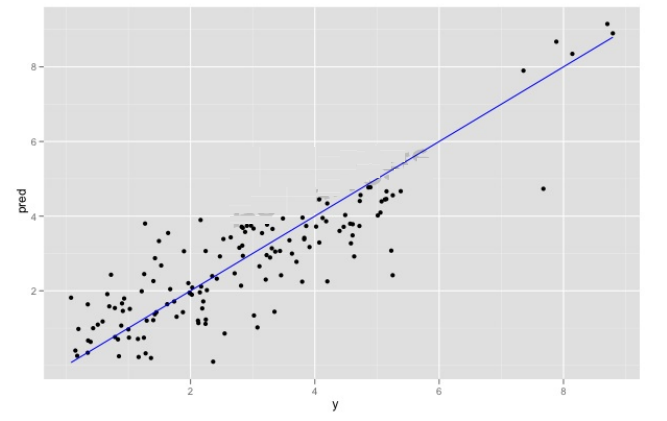
You have run a linear regression model against your data, and have plotted true outcome versus predicted outcome. The R-squared of your model is 0.75. What is your assessment of the model?