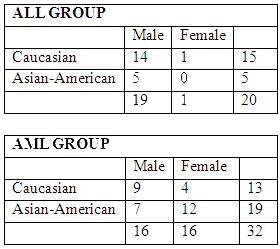
There are 20 patients with acute lymphoblastic leukemia (ALL) and 32 patients with acute myeloid
leukemia (AML), both variants of a blood cancer.
The makeup of the groups as follows:
Each individual has an expression value for each of 10000 different genes. The expression value
for each gene is a continuous value between -1 and 1.
With which type of plot can you encode the most amount of the data visually?
Rather than use all 10,000 features to separate AML from ALL, you pick a small subnet of features
to separate them optimally. You feature vectors have 10,000 dimensions while you only have 52
data points. You use cross-validation to test your chosen set of features. What three methods will
choose the features in an optimal way?
A.
Singular value Decomposition
B.
Bootstrapping
C.
Markov chain Monte Carlo
D.
Hidden Markov
E.
Bayesian Information Criterion
F.
Mutual Information