

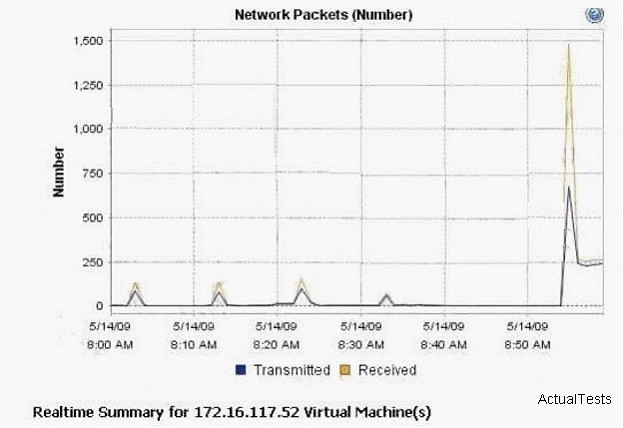
The graph shown in the exhibit indicates which of the following?

A.
Average amount of time spent by the VMkernel processing SCSI read and write commands
B.
Average amount of time spent reading and writing to the physical storage device
C.
Average amount of time SCSI reads and writes spend in the queue
D.
Average amount of time required to read and write from the Guest OS to the Virtual machine virtual disk file