

There are 20 patients with acute lymphoblastic leukemia (ALL) and 32 patients with acute myeloid
leukemia (AML), both variants of a blood cancer.
The makeup of the groups as follows: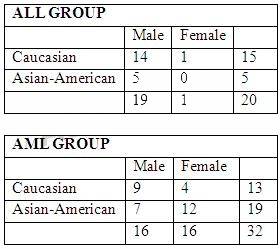
Each individual has an expression value for each of 10000 different genes. The expression value
for each gene is a continuous value between -1 and 1.
With which type of plot can you encode the most amount of the data visually?

A.
A heat map sorting the individuals by group
B.
A histogram of the expression values
C.
A scatter plot of two largest principal components