

What is the most reliable way to fix this problem?
There are 20 patients with acute lymphoblastic leukemia (ALL) and 32 patients with acute myeloid
leukemia (AML), both variants of a blood cancer.
The makeup of the groups as follows: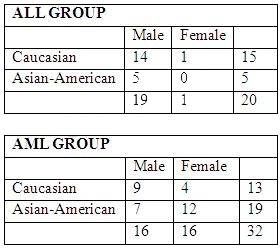
Each individual has an expression value for each of 10000 different genes. The expression value
for each gene is a continuous value between -1 and 1.
You’ve built your model for discriminating between AML and ALL patients and you find that it
works quite well on your current data. One month later, a collaboration tells you she has fresh
data from 100 new AML/ALL patients. You run the samples through your model, and turns out
your model has very poor predictive accuracy on the new samples; specifically, your model
predicts that all males have ALL. What is the most reliable way to fix this problem?
What type of data science problem is this?
There are 20 patients with acute lymphoblastic leukemia (ALL) and 32 patients with acute myeloid
leukemia (AML), both variants of a blood cancer.
The makeup of the groups as follows:
Each individual has an expression value for each of 10000 different genes. The expression value
for each gene is a continuous value between -1 and 1.
You want to use the data from the 52 patients in the scenario to improve the ability of doctors
being able to distinguish between ALL and AML. What type of data science problem is this?
which type of plot can you encode the most amount of the data visually?
There are 20 patients with acute lymphoblastic leukemia (ALL) and 32 patients with acute myeloid
leukemia (AML), both variants of a blood cancer.
The makeup of the groups as follows: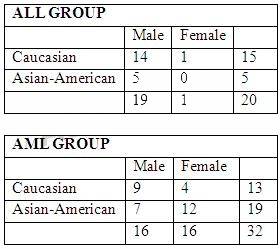
Each individual has an expression value for each of 10000 different genes. The expression value
for each gene is a continuous value between -1 and 1.
With which type of plot can you encode the most amount of the data visually?
which type of plot can you encode the most amount of the data visually?
There are 20 patients with acute lymphoblastic leukemia (ALL) and 32 patients with acute myeloid
leukemia (AML), both variants of a blood cancer.
The makeup of the groups as follows: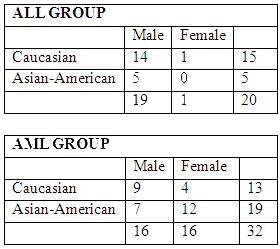
Each individual has an expression value for each of 10000 different genes. The expression value
for each gene is a continuous value between -1 and 1.
With which type of plot can you encode the most amount of the data visually?
Rather than use all 10,000 features to separate AML from ALL, you pick a small subnet of features
to separate them optimally. You feature vectors have 10,000 dimensions while you only have 52
data points. You use cross-validation to test your chosen set of features. What three methods will
choose the features in an optimal way?
which type of plot can you encode the most amount of the data visually?
There are 20 patients with acute lymphoblastic leukemia (ALL) and 32 patients with acute myeloid
leukemia (AML), both variants of a blood cancer.
The makeup of the groups as follows:
Each individual has an expression value for each of 10000 different genes. The expression value
for each gene is a continuous value between -1 and 1.
With which type of plot can you encode the most amount of the data visually?
You choose to perform agglomerative hierarchical clustering on the 10,000 features. How much
RAM do you need to hold the distance Matrix, assuming each distance value is 64-bit double?
What does your first singular component describe?
You have a large m x n data matrix M. You decide you want to perform dimension
reduction/clustering on your data and have decide to use the singular value decomposition (SVD;
also called principal components analysis PCA)
You performed singular value decomposition (SVD; also called principal components analysis or
PCA) on you data matrix but you did not center your data first. What does your first singular
component describe?
What represents the SVD of the Matrix standard M given the following information:
You have a large m x n data matrix M. You decide you want to perform dimension
reduction/clustering on your data and have decide to use the singular value decomposition (SVD;
also called principal components analysis PCA)
Refer to the passage above.
What represents the SVD of the Matrix standard M given the following information:
U is m x m unitary
V is n x n unitary
S is m x n diagonal
Q is n x n invertible
D is n x n diagonal
L is m x m lower triangular
U is m x m upper triangular
Which line represents the second principal component?
You have a large m x n data matrix M. You decide you want to perform dimension
reduction/clustering on your data and have decide to use the singular value decomposition (SVD;
also called principal components analysis PCA)
For the moment, assume that your data matrix M is 500 x 2. The figure below shows a plot of the data.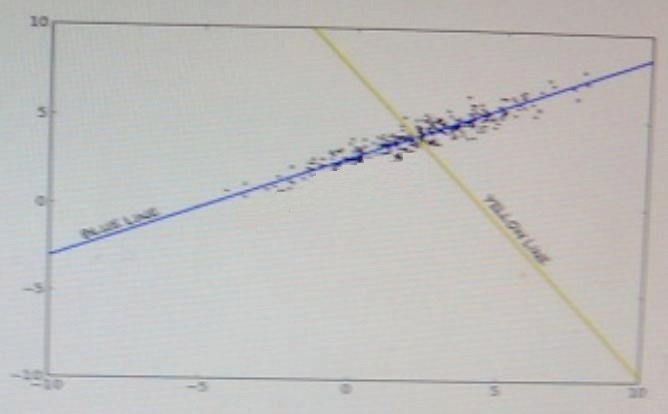
Which line represents the second principal component?
Many machine learning algorithm involve finding the Global minimum of a convex loss function, primarily becaus
Many machine learning algorithm involve finding the Global minimum of a convex loss function,
primarily because:
Which two techniques should you use to avoid overfitting a classification model to a data set?
Which two techniques should you use to avoid overfitting a classification model to a data set?